- Page 1 and 2: WATER & SOIL TECHNICAL PUBLICATION
- Page 3 and 4: Regional flood est¡mat¡on in New
- Page 5 and 6: Tables 1.1 Risk ofexceedence for sp
- Page 7 and 8: Preface Water & soil technical publ
- Page 9 and 10: annual flood Q (the mean of the ann
- Page 11 and 12: Water & soil technical publication
- Page 13 and 14: Doto ovoiloble on TIDEDA Figure 2'1
- Page 15 and 16: P=45 O= 15 x4 (l) '= o o t.25 2'.O
- Page 17 and 18: Êv2 ( ko) Reduced Voriote y I'O t1
- Page 19 and 20: turn period. A plotting position fo
- Page 21 and 22: 'o ,l\, I zl l- I Water & soil tech
- Page 23 and 24: Table 3.2 Flow stat¡ons used. SITE
- Page 25 and 26: e process of examining the simtrend
- Page 27: Iì_ t_ I I I I I I I t-. I I tñ I
- Page 31 and 32: SOUTHEBN REDUCEO Y VRBIßTE NETURN
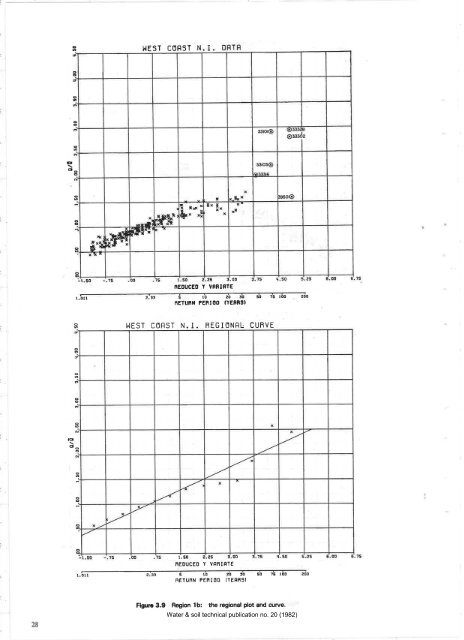
- Page 33 and 34: SOUTH ISLFND HEST COFST I]ÊTR èo
- Page 35 and 36: SOUTH CÊNTERBURY DRTÊ NEOUCEO Y V
- Page 37 and 38: COMB I NED ,,IE5T CORST DRTR o rt
- Page 39 and 40: BÊY OF PLENTY DRTF o o o NEOUCEO Y
- Page 41 and 42: NOBTH ISLRND ßEGIONÊL CUBVES 1.50
- Page 43 and 44: data for this area are required bef
- Page 45 and 46: NELSON REGIONFL CURVE BEOUCEO Y VRR
- Page 47 and 48: 46 EÊSTEFìN NEI,,I ZEFLÊND DÊTI
- Page 49 and 50: Table 3.9 The grouping and the grou
- Page 51 and 52: allowing curves rather than just st
- Page 53 and 54: 3.5.5 Extension method The NERC (19
- Page 55 and 56: Table 4.1 South lsland catchment ch
- Page 57 and 58: I 2 t l¡ 5 5 7 I 9 l0 t1 ,12 I5 1{
- Page 59 and 60: decided instead to use estimates of
- Page 61 and 62: \Í l{ I t, ìj( Fþurc 4.4 Distrib
- Page 63 and 64: 62 Fþurc 4,6 Logarithmic rcsidual
- Page 65 and 66: Table 4.6 Final equations for South
- Page 67 and 68: I ++ ++ * E 4.6 Analysis of North l
- Page 69 and 70: Non Pumice = õ = 3-24xto'6 AREA'7
- Page 71 and 72: Northlond f C"ro^ondel f Eost Cope
- Page 73 and 74: Table 4.11 Comparable equations for
- Page 75 and 76: Poo led cv Pooled o.40 F¡guro 4.12
- Page 77 and 78: mates of Cp typically range between
- Page 79 and 80:
-J æ 'll o Eo !¡ Assemble llood p
- Page 81 and 82:
Year 1958 1959 1960 l96r t962 1963
- Page 83 and 84:
The estimate of Q from the regional
- Page 85 and 86:
Water & soil technical publication
- Page 87 and 88:
Maguiness, J.A.; Blackwood, P.L.; B
- Page 89 and 90:
The liequency factor K is a functio
- Page 91 and 92:
e.9., Linsley et ol. (1915); lrish
- Page 93 and 94:
Maguiness, J.A.; Blackwood, P.L.; B
- Page 95 and 96:
sltt 930 t [rûltRÀict ¡ l? s;¡t
- Page 97 and 98:
3950't flrlÀRt R tr îlt¡Ît ;tP
- Page 99 and 100:
S ITI 29202 RuNttiltcl I ¡t tllEtt
- Page 101 and 102:
ïI-'_____ ::19: lt¡IPt0r n À1 i
- Page 103 and 104:
9100r GNE? R ¡T DOBSO| s¡18 93207
- Page 105 and 106:
6800 1 sBlrri R tT SrITEC¡,tttS 6I
- Page 107 and 108:
APPENDIX C Summary of tho data for
- Page 109 and 110:
oæ ON LAT. STATION NA ATION LAT. N
- Page 111 and 112:
o NUI,IBER HHAKAIIARU 854801 38 L7'
- Page 113 and 114:
l9 AT NU¡IB ËR AR',tËtlANA ÂRAI
- Page 115 and 116:
A ON LAT. STATION NA NUMBER AHUNA 5
- Page 117 and 118:
â NUI,IBER Lü{G.E ON NU14EER I,IU
- Page 119 and 120:
æ TATI ¡rouNT sor.tERS 7L740? 43
- Page 121 and 122:
N) o STATIoN NAr{gmLfï3---ffij NUI
- Page 123 and 124:
APPENDIX E Compadson of Regional Fl
- Page 125 and 126:
Table F.2 Flood peak data. NEW OTAG
- Page 127 and 128:
F.3 Analysis and results tatively p
- Page 129 and 130:
ét êt REOUCEO VßFIHTE 2. 33 5 l0
- Page 131 and 132:
SOLITH I EA l') COAST soUTH CANTERB
- Page 133 and 134:
0tiftflt a itÉitut5 ü¡. il/5 tg?
- Page 135:
Water & soil technical publication