

WATER & SOIL - These are not the droids you are looking for.
WATER & SOIL - These are not the droids you are looking for.
WATER & SOIL - These are not the droids you are looking for.

You also want an ePaper? Increase the reach of your titles
YUMPU automatically turns print PDFs into web optimized ePapers that Google loves.
decided instead to use estimates of <strong>the</strong> 24-hour dura_<br />
tion 2-year return period rainfall derived from <strong>the</strong><br />
more extensive net$,ork of daily_read gauges, since<br />
<strong>the</strong>se could be extrapolated to remotè catchments<br />
with greater confidence.<br />
The use,of a 2-year recurrence interval seemed ap_<br />
propriate because <strong>the</strong> mean annual flood has a rècurrence<br />
interval only slightly greater than 2 years,<br />
2.33 years if <strong>the</strong> annual ma,rimã con<strong>for</strong>m to <strong>the</strong> extreme<br />
value Type I (Gumbel) distribution. Estimates<br />
of this parameter (without <strong>the</strong> application of an<br />
<strong>are</strong>al reduction factor) were made from Robertson's<br />
data <strong>for</strong> each catchment using rainfall stations with_<br />
in, or near to, <strong>the</strong> catchment. <strong>These</strong> estimates were<br />
<strong>not</strong> adjusted <strong>for</strong> effects of altitude.<br />
<strong>These</strong> eight characteristics were estimated <strong>for</strong> each catchment<br />
(Table 4.1 and 4.2 <strong>for</strong> <strong>the</strong> SI and NI respectively). For<br />
those catchments <strong>not</strong> contoured, channel slópe and mean<br />
elevation were undefined; <strong>the</strong>re were 5 such bouth Island<br />
catchments and 7 North Island catchments.<br />
4.5 Analys¡s of South lsland data<br />
4.5.1 Preliminary examinat¡on of data<br />
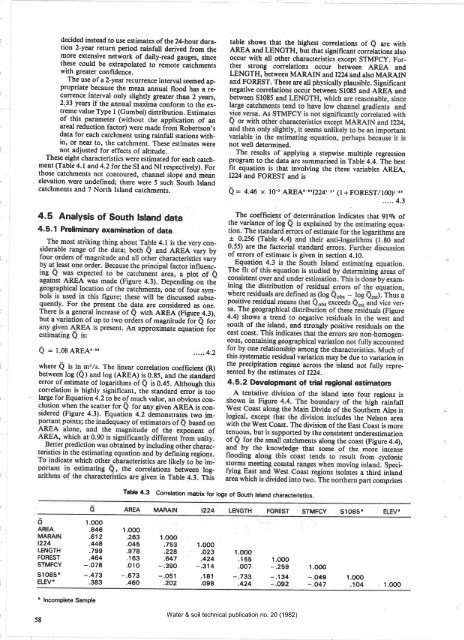
table shows that <strong>the</strong> highest correlations of Q <strong>are</strong> with<br />
AREA and LENGTH, but that signifìcant correlations also<br />
occur with all o<strong>the</strong>r characteristics except STMFCy. Fur<strong>the</strong>r<br />
strong correlations occur between AREA and<br />
LENGTH, between MARAIN andl2}4andalso MARAIN<br />
and FOREST. <strong>These</strong> <strong>are</strong> all physically plausible. Significant<br />
negative correlations occur between Sl0B5 and AREA and<br />
<strong>not</strong> well determined.<br />
The results of applying a, stepwise multiple regression<br />
program to <strong>the</strong> data <strong>are</strong> summarised in Table 4.4. The best<br />
fit equation is that involving <strong>the</strong> three variables AREA,<br />
I2A and FOREST and is<br />
Q = 4.40 x l0{ AREAÙ.¿'12241.27 (l +FOREST/lcf|/)t 6'<br />
.....4.3<br />
The coefficient of determination indicates that glgo of<br />
of errors of estimate is given in section 4.10.<br />
quently. For <strong>the</strong> present <strong>the</strong> data <strong>are</strong> considered as one.<br />
with AREA (Figure 4.3),<br />
rs of magnitude <strong>for</strong> Q <strong>for</strong><br />
approximate equation <strong>for</strong><br />
south of <strong>the</strong> island, and strongly positive residuals on <strong>the</strong><br />
Q = I.9SAREAo eo 42<br />
where Q is in_m3ls. The linear correlation coefficient (R)<br />
between loe (Q) and log (AREA) is 0.85, and <strong>the</strong> stand;rá<br />
error-of_estimate of logarithms of Q is 0.45. Although this<br />
correlation is highly significant, <strong>the</strong> standard errorls too<br />
large <strong>for</strong> Equation 4.2 to be of much value, an obvious con_<br />
clusion when <strong>the</strong> scatter <strong>for</strong> Q <strong>for</strong> any given AREA is con_<br />
sidered (Figure 4.3). Equation 4.2 demonstrates two im-<br />
this systematic residual variation may be due to variation in<br />
<strong>the</strong> precipitation regime across <strong>the</strong> island <strong>not</strong> fully represented<br />
by <strong>the</strong> estimates of 1221.<br />
4.5.2 Development of tdal rcgionalest¡mators<br />
into four regions is<br />
of <strong>the</strong> high rainfall<br />
<strong>the</strong> Sou<strong>the</strong>rn Alps is<br />
des <strong>the</strong> Nelson <strong>are</strong>a<br />
with <strong>the</strong> \Vest Coast. The division of <strong>the</strong> East Coast is more<br />
tenuous, but is supported by <strong>the</strong> consistent underestimation<br />
of Q <strong>for</strong> <strong>the</strong> small catchments along <strong>the</strong> coast (Figure 4.4),<br />
and by <strong>the</strong> knowledge that some of <strong>the</strong> morè intenie<br />
from cyclonic<br />
inland. Specia<br />
third inland<br />
part comprises<br />
T¡He 4.3 Correlation matrix <strong>for</strong> logs of South lsland characteristics.<br />
MARAIN STMFCY s1 085. ELEV*<br />
o<br />
AREA<br />
MARAIN<br />
1224<br />
LENGTH<br />
FOREST<br />
STMFCY<br />
s1085.<br />
ELEV'<br />
l.OOO<br />
.846<br />
.612<br />
.448<br />
.799<br />
.464<br />
-.078<br />
-.473<br />
.383<br />
1.OO0<br />
.2e3<br />
.045<br />
.978<br />
.163<br />
,010<br />
-.673<br />
.460<br />
l.OOO<br />
.753<br />
.228<br />
.647<br />
-.390<br />
-.o51<br />
.ioz<br />
l.OOO<br />
.o23<br />
.424<br />
-.314<br />
.181<br />
.o98<br />
l.OOO<br />
.155<br />
.oo7<br />
-.733<br />
.424<br />
l.OOO<br />
-.259<br />
-.134<br />
-.092<br />
l.OOO<br />
-,049<br />
-.o47<br />
l.OOO<br />
.10,4<br />
1.OO0<br />
I lncomplete Sample<br />
58<br />
Water & soil technical publication no. 20 (1982)


