WATER & SOIL - These are not the droids you are looking for.
WATER & SOIL - These are not the droids you are looking for.
WATER & SOIL - These are not the droids you are looking for.
You also want an ePaper? Increase the reach of your titles
YUMPU automatically turns print PDFs into web optimized ePapers that Google loves.
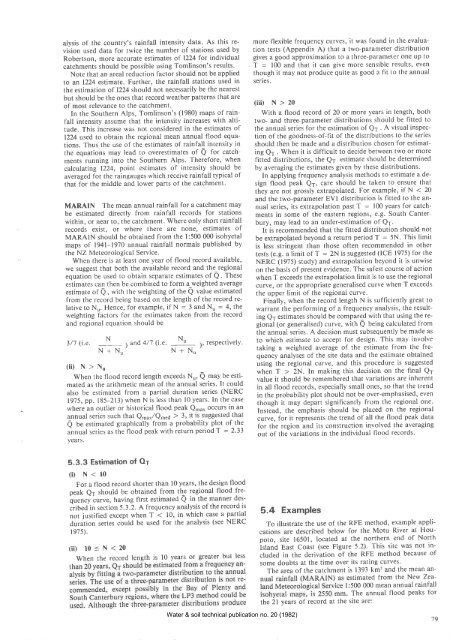
alysis of <strong>the</strong> country's rainfall intensity data. As this revision<br />
used data <strong>for</strong> twice <strong>the</strong> number of stations used by<br />
Robertson, more accurate estimates of 1024 <strong>for</strong> individual<br />
catchments should be possible using Tomlinson's results.<br />
Note that an <strong>are</strong>al reduction factor should <strong>not</strong> be applied<br />
to an 1224 estimate. Fur<strong>the</strong>r, <strong>the</strong> rainfall stations used in<br />
<strong>the</strong> estimation of 1224 should <strong>not</strong> necessarily be <strong>the</strong> ne<strong>are</strong>st<br />
but should be <strong>the</strong> ones that record wea<strong>the</strong>r patterns that <strong>are</strong><br />
of most relevance to <strong>the</strong> catchment.<br />
In <strong>the</strong> Sou<strong>the</strong>rn Alps, Tomlinson's (1980) maps of rainfall<br />
intensity assume that <strong>the</strong> intensity increases with altitude.<br />
This increase was <strong>not</strong> considered in <strong>the</strong> estimates of<br />
1224 used to obtain <strong>the</strong> regional mean annual flood equations.<br />
Thus <strong>the</strong> use of <strong>the</strong> estimates of rainfall intensity in<br />
<strong>the</strong> equations may lead to overestimates of Q <strong>for</strong> catchments<br />
running into <strong>the</strong> Sou<strong>the</strong>rn Alps. There<strong>for</strong>e, when<br />
calculating 1224, poinr estimates of intensity should be<br />
averaged <strong>for</strong> <strong>the</strong> raingauges which receive rainfall typical of<br />
that <strong>for</strong> <strong>the</strong> middle and lower parts of <strong>the</strong> catchment.<br />
MARAIN The mean annual rainfall <strong>for</strong> a catchment may<br />
be estimated directly from rainfall records <strong>for</strong> stations<br />
within, or near to, <strong>the</strong> catchment. Where only short rainfall<br />
records exist, or where <strong>the</strong>re <strong>are</strong> none, estimates of<br />
MARAIN should be obtained from <strong>the</strong> l:500 000 isohyetal<br />
maps of l94l-1970 annual rainfall normals published by<br />
<strong>the</strong> NZ Meteorological Service.<br />
When <strong>the</strong>re is at least one year of flood record available,<br />
we suggest that both <strong>the</strong> available record and <strong>the</strong> regional<br />
equation be used to obtain separate estimates of Q. <strong>These</strong><br />
estimates can <strong>the</strong>n be combined to <strong>for</strong>m a weighted average<br />
estimate of Q , with <strong>the</strong> weighting of <strong>the</strong> Q value estimated<br />
from <strong>the</strong> record being based on <strong>the</strong> length of<strong>the</strong> record relative<br />
to Nr. Hence, <strong>for</strong> example, if N : 3 and N, : 4' <strong>the</strong><br />
weighting factors <strong>for</strong> <strong>the</strong> estimates taken from <strong>the</strong> record<br />
and regional equation should be<br />
3/'7 lì.e.<br />
(ii) N > Nu<br />
NN<br />
N+Nu<br />
N*N,<br />
When <strong>the</strong> flood record length exceeds N' Q may be estimated<br />
as <strong>the</strong> arithmetic mean of <strong>the</strong> annual series. It could<br />
also be estimated f¡om a partial duration series (NERC<br />
1975, pp. 185-213) when N is less than l0 years. In <strong>the</strong> case<br />
where an outlier or historical flood peak Q."* occurs in an<br />
annual series such that Q*"*/Q.e¿ ) 3, it is suggested that<br />
Q be estimated graphically from a probability plot of <strong>the</strong><br />
annual series as <strong>the</strong> flood peak with return period T : 2.33<br />
years.<br />
more flexible frequency curves, it was found in <strong>the</strong> evaluation<br />
tests (Appendix A) that a two-parameter distribution<br />
gives a good approximation to a three-parameter one up to<br />
T : 100 and that it can give more sensible results, even<br />
though it may <strong>not</strong> produce quite as good a fit to <strong>the</strong> annual<br />
senes.<br />
(iii) N > 20<br />
V/ith a flood record of 20 or more years in length, both<br />
two- and three-parameter distributions should be fitted to<br />
tbe annual series <strong>for</strong> <strong>the</strong> estimation of Qr ' A visual inspection<br />
of <strong>the</strong> goodness-of-fit of <strong>the</strong> distributions to <strong>the</strong> series<br />
should <strong>the</strong>n be made and a distribution chosen <strong>for</strong> estimating<br />
Qr . When it is difficult to decide between two or more<br />
fitted distributions, <strong>the</strong> Q.¡ estimate should be determined<br />
by averaging <strong>the</strong> estimates given by <strong>the</strong>se distributions.<br />
In applying frequency analysis methods to estimate a design<br />
flood peak Qt, c<strong>are</strong> should be taken to ensure that<br />
<strong>the</strong>y <strong>are</strong> <strong>not</strong> grossly extrapolated. For example, if N < 20<br />
and <strong>the</strong> two-parameter EVI distribution is fitted to <strong>the</strong> annual<br />
series, its extrapolation past T : 100 years <strong>for</strong> catchments<br />
in some of <strong>the</strong> eastern regions, e.g' South Canterbury,<br />
may lead to an under-estimation of Q1.<br />
It is recommended that <strong>the</strong> fitted distribution should <strong>not</strong><br />
be extrapolated beyond a return period T : 5N' This limit<br />
is less stringent than those often recommended in o<strong>the</strong>r<br />
tests (e.g. a limit of T : 2N is suggested (ICE 1975) <strong>for</strong> <strong>the</strong><br />
NERC (1975) study) and extrapolation beyond it is unwise<br />
on <strong>the</strong> basis of present evidence. The safest course of action<br />
when T exceeds <strong>the</strong> extrapolation limit is to use <strong>the</strong> regional<br />
curve, or <strong>the</strong> appropriate generalised curve when T exceeds<br />
<strong>the</strong> upper limit of <strong>the</strong> regional curve.<br />
Finally, when <strong>the</strong> record length N is sufficiently great to<br />
warrant <strong>the</strong> per<strong>for</strong>ming of a frequency analysis, <strong>the</strong> resulting<br />
Q1 estimates should be comp<strong>are</strong>d with that using <strong>the</strong> regional<br />
(or generalised) curve, with Q being calculated from<br />
<strong>the</strong> annual series. A, decision must subsequently be made as<br />
to which estimate to accept <strong>for</strong> design. This may involve<br />
taking a weighted average of <strong>the</strong> estimate from <strong>the</strong> frequency<br />
analyses of <strong>the</strong> site data and <strong>the</strong> estimate obtained<br />
using <strong>the</strong> regional curve, and this procedure is suggested<br />
when T > 2N. In making this decision on <strong>the</strong> final Q1<br />
value it should be lemembered that variations <strong>are</strong> inherent<br />
in all flood records, especially small ones, so that <strong>the</strong> trend<br />
in <strong>the</strong> probability plot should <strong>not</strong> be over-emphasised, even<br />
though it may depart significantly from <strong>the</strong> regional one.<br />
Instead, <strong>the</strong> emphasis should be placed on <strong>the</strong> regional<br />
curve, <strong>for</strong> it represents <strong>the</strong> trend of all <strong>the</strong> flood peak data<br />
<strong>for</strong> <strong>the</strong> region and its construction involved <strong>the</strong> averaging<br />
out of <strong>the</strong> variations in <strong>the</strong> individual flood records.<br />
5.3.3 Estimation of 01<br />
(i) N


