

WATER & SOIL - These are not the droids you are looking for.
WATER & SOIL - These are not the droids you are looking for.
WATER & SOIL - These are not the droids you are looking for.

You also want an ePaper? Increase the reach of your titles
YUMPU automatically turns print PDFs into web optimized ePapers that Google loves.
amination of <strong>the</strong> probability plots <strong>for</strong> each station, <strong>the</strong> perlormance<br />
of each frequency analysis method was classified<br />
into a good, reasonable or poor category according to <strong>the</strong><br />
following four criteria:<br />
(i) <strong>the</strong> frequency curve should fit <strong>the</strong> whole of <strong>the</strong> series<br />
well, but particularly <strong>the</strong> upper half of <strong>the</strong> series;<br />
(¡i) <strong>the</strong> frequency curve should <strong>not</strong> necessarily pass<br />
through <strong>the</strong> very largest items in <strong>the</strong> series, since <strong>the</strong>re<br />
is a far larger sampling variation with <strong>the</strong>se items;<br />
(¡¡¡) <strong>the</strong> frequency curve should appear to produce a good<br />
estimate of <strong>the</strong> 10O-year flood peak;<br />
(iv) <strong>the</strong> Chi-squ<strong>are</strong> value should <strong>not</strong> be abnormally high.<br />
Criterion (iii) needs some explanation. Although a<br />
method could per<strong>for</strong>m well under criterion (i), it could <strong>not</strong><br />
be automatically assumed that <strong>the</strong> method <strong>the</strong>re<strong>for</strong>e gave a<br />
sensible estimate oI <strong>the</strong> 10O-year flood peak. Because of <strong>the</strong><br />
small-sample effect with some of <strong>the</strong> samples used, a method<br />
could produce an extremely good fit to a data sample<br />
but a 100-year value that was only minimally greater (e.9.,<br />
less than l-290) than <strong>the</strong> 2O-year value. One hundred years<br />
was chosen as <strong>the</strong> return period <strong>for</strong> <strong>the</strong> flood peak estimate<br />
on <strong>the</strong> basis of it being <strong>the</strong> most commonly used maximum<br />
value in bridge waterway design (MWD 1979). It follows,<br />
<strong>the</strong>re<strong>for</strong>e, that <strong>the</strong> subsequent evaluations of <strong>the</strong> methods<br />
<strong>for</strong> fitting individual station data <strong>are</strong> with reference to this<br />
maximum return period and <strong>the</strong>y should <strong>not</strong> be interpreted<br />
as being applicable beyond <strong>the</strong> 100-year return period.<br />
Afler <strong>the</strong> classification of <strong>the</strong> per<strong>for</strong>mances of <strong>the</strong><br />
methods <strong>the</strong>y were <strong>the</strong>n quantified, by allotting a score of 2<br />
<strong>for</strong> each good fit, I lor each reasonable fit and 0 <strong>for</strong> each<br />
poor fit.<br />
A.4.3 F¡rst test<br />
The first evaluation test was made midway through <strong>the</strong><br />
data collection phase when all <strong>the</strong> annual flood peak data<br />
had been collected <strong>for</strong> <strong>the</strong> South Island stations. The results<br />
of this test were presented and discussed by Maguiness et al.<br />
(1977). Of <strong>the</strong> 50 stations <strong>for</strong> which data were available, 28<br />
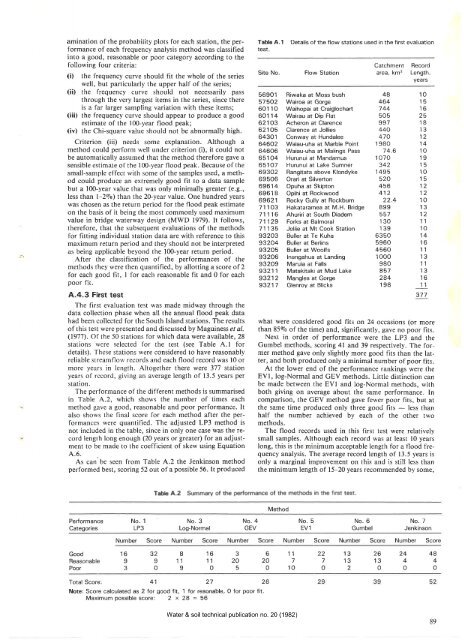
stations were selected <strong>for</strong> <strong>the</strong> test (see Table A. I <strong>for</strong><br />
details). <strong>These</strong> stations were considered to have reasonably<br />
reliable streamflow records and each flood record was l0 or<br />
more years in length. Altoge<strong>the</strong>r <strong>the</strong>re were 377 station<br />
years of rccord, giving an average length of 13.5 years per<br />
station.<br />
The per<strong>for</strong>mance of <strong>the</strong> different methods is summarised<br />
in Table 4.2, which shows <strong>the</strong> number of times each<br />
method gave a good, reasonable and poor per<strong>for</strong>mance. It<br />
also shows <strong>the</strong> final score <strong>for</strong> each method after <strong>the</strong> per<strong>for</strong>mances<br />
were quantified. The adjusted LP3 method is<br />
<strong>not</strong> included in <strong>the</strong> table, since in only one case was <strong>the</strong> record<br />
length long enough (20 years or greater) <strong>for</strong> an adjustment<br />
to be made to <strong>the</strong> coefficient of skew using Equation<br />
4.6.<br />
As can be seen from Table 4.2 <strong>the</strong> Jenkinson method<br />
per<strong>for</strong>med best, scoring 52 out of a possible 56. lt produced<br />
Table 4.1 Deta¡ls of <strong>the</strong> f low stations used in <strong>the</strong> first evaluation<br />
test.<br />
Site No.<br />
56901<br />
57502<br />
60110<br />
60114<br />
621 03<br />
621 05<br />
64301<br />
64602<br />
64606<br />
65104<br />
65107<br />
69302<br />
69506<br />
69614<br />
6961 I<br />
6962 1<br />
71 103<br />
71116<br />
71129<br />
7'l 135<br />
93203<br />
93204<br />
93205<br />
93206<br />
93209<br />
93211<br />
93212<br />
93217<br />
Flow Station<br />
Catchmenl Record<br />
<strong>are</strong>a, km' Length,<br />
Years<br />
Riwaka at Moss bush 48 10<br />
Wairoa at Gorge 464 15<br />
Waihopai at Craiglochart 744 16<br />
Wairau at Dip Flat 505 25<br />
Acheron at Cl<strong>are</strong>nce 997 18<br />
Cl<strong>are</strong>nce at Jollies 44O<br />
'l 3<br />
Conway at Hundalee 47O 12<br />
Waiau-uha at Marble Point 1980 14<br />
Waiau-uha at Malings Pass 74-6 10<br />
Hurunui at Mandamus 1 O7O 1 I<br />
Hurunui at Lake Sumner 342 1 5<br />
Rangitata above Klondyke 1495 10<br />
Orari at Silverton 52O 15<br />
Opuha at Skipton 456 12<br />
Opihi at Rockwood 412 12<br />
Rocky Gully at Rockburn 22.4 10<br />
Hakataramea at M.H. Bridge 899 13<br />
Ahuriri at South Diadem 557 12<br />
Forks at Balmoral 13O<br />
'l 1<br />
Jollie at Mt Cook Station 1 39 10<br />
Buller at Te Kuha 6350 14<br />
Buller at Berlins 5960 16<br />
Buller at Woolfs 4560 11<br />
lnangahua at Land¡ng 1000<br />
'l 3<br />
Maruia at Falls 980 1 1<br />
Matakitaki at Mud Lake 857 13<br />
Mangles at Gorge 284 16<br />
Glenroy at Blicks 198 1 1<br />
377<br />
what were considered good fits on 24 occasions (or more<br />
than 8590 of <strong>the</strong> time) and, significantly, gave no poor fits.<br />
Next in order of per<strong>for</strong>mance were <strong>the</strong> LP3 and <strong>the</strong><br />
Gumbel methods, scoring 4l and 39 respectively. The <strong>for</strong>mer<br />
method gave only slightly more good fits than <strong>the</strong> latter,<br />
and both produced only a minimal number of poor fits.<br />
At <strong>the</strong> lower end of <strong>the</strong> per<strong>for</strong>mance rankings were <strong>the</strong><br />
EVl,log-Normal and GEV methods. Little distinction can<br />
be made between <strong>the</strong> EVI and log-Normal methods, with<br />
both giving on average about <strong>the</strong> same per<strong>for</strong>mance. In<br />
comparison, <strong>the</strong> CEV method gave fewer poor fits, but at<br />
<strong>the</strong> same time produced only three good lits -<br />
less than<br />
half <strong>the</strong> number achieved by each of <strong>the</strong> o<strong>the</strong>r two<br />
methods.<br />
The flood records used in this first test were relatively<br />
small samples. Although each record was at least l0 years<br />
long, this is <strong>the</strong> minimum acceptable length <strong>for</strong> a flood frequency<br />
analysis. The average record length of 13.5 years is<br />
only a marginal improvement on this and is still less than<br />
<strong>the</strong> minimum length of l5-20 years recommended by some,<br />
Table 4.2 Summary of <strong>the</strong> per<strong>for</strong>mance of <strong>the</strong> methods ¡n <strong>the</strong> f¡rst test.<br />
Method<br />
Per<strong>for</strong>mance<br />
Categories<br />
No. 1<br />
LP3<br />
No. 3<br />
Log-Normal<br />
No. 4<br />
GEV<br />
No. 5<br />
EV1<br />
No. 6<br />
Gumbel<br />
No. 7<br />
Jenkinson<br />
Good<br />
Reasonable<br />
Poor<br />
Number Score Number Score Number Score Number Score Number Score Number Score<br />
16 32<br />
99<br />
30<br />
Total Score:<br />
4'l<br />
27 26<br />
Note: Score calculated as 2 <strong>for</strong> good fit, 1 <strong>for</strong> resonable, O <strong>for</strong> poor fit.<br />
Maximum possible score: 2 x 2a :56<br />
8<br />
'l 6 3 6 11 22 13 26 24 48<br />
11 11 20 20 7 7 13 13 4 4<br />
9 0 5 0 10 0 2 0 0 0<br />
Water & soil technical publication no. 20 (1982)<br />
89


