WATER & SOIL - These are not the droids you are looking for.
WATER & SOIL - These are not the droids you are looking for.
WATER & SOIL - These are not the droids you are looking for.
Create successful ePaper yourself
Turn your PDF publications into a flip-book with our unique Google optimized e-Paper software.
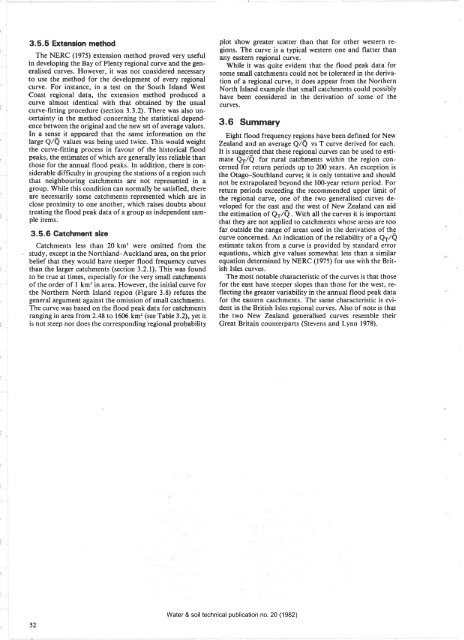
3.5.5 Extension method<br />
The NERC (1975) extension method proved very useful<br />
in developing <strong>the</strong> Bay of Plenty regional curve and <strong>the</strong> generalised<br />
curves. However, it was <strong>not</strong> considered necessary<br />
to use <strong>the</strong> method <strong>for</strong> <strong>the</strong> development of every regional<br />
curve. For instance, in a test on <strong>the</strong> South Island tr)Vest<br />
Coast regional data, <strong>the</strong> extension method produced a<br />
curve almost identical with that obtained by <strong>the</strong> usual<br />
curve-fitting procedure (section 3.3.2). There was also uncertainty<br />
in <strong>the</strong> method concerning <strong>the</strong> statistical dependence<br />
between <strong>the</strong> original and <strong>the</strong> new set of average values.<br />
In a sense it appe<strong>are</strong>d that <strong>the</strong> same in<strong>for</strong>mation on <strong>the</strong><br />
large Q/Q values was being used twice. This would weight<br />
<strong>the</strong> curve-fitting process in favour of <strong>the</strong> historical flood<br />
peaks, <strong>the</strong> estimat€s of which <strong>are</strong> generally less reliable than<br />
those <strong>for</strong> <strong>the</strong> annual flood peaks. In addition, <strong>the</strong>re is considerable<br />
difficulty in grouping <strong>the</strong> stations of a region such<br />
that neighbouring catchments <strong>are</strong> <strong>not</strong> represented in a<br />
group. While this condition can normally be satisfied, <strong>the</strong>re<br />
<strong>are</strong> necessarily some catchments represented which <strong>are</strong> in<br />
close proximity to one a<strong>not</strong>her, which raises doubts about<br />
treating <strong>the</strong> flood peak data of a group as independent sample<br />
items.<br />
3.5.6 Catchment s¡ze<br />
Catchments less than 20 km'? were omitted from <strong>the</strong><br />
study, except in <strong>the</strong> Northland-Auckland <strong>are</strong>a, on <strong>the</strong> prior<br />
belief that <strong>the</strong>y would have steeper flood frequency curves<br />
than <strong>the</strong> larger catchments (section 3.2.1). This was found<br />
to be true at times, especially <strong>for</strong> <strong>the</strong> very small catchments<br />
of <strong>the</strong> order of I km' in <strong>are</strong>a. However, <strong>the</strong> initial curve <strong>for</strong><br />
<strong>the</strong> Nor<strong>the</strong>rn North Island region (Figure 3.8) refutes <strong>the</strong><br />
general argument against <strong>the</strong> omission of small catchments.<br />
The curve was based on <strong>the</strong> flood peak däta <strong>for</strong> catchments<br />
ranging in <strong>are</strong>a from 2.48 to 1606 km':(see Table 3.2), yet it<br />
is <strong>not</strong> steep nor does <strong>the</strong> corresponding regional probability<br />
plot show greater scatter than that <strong>for</strong> o<strong>the</strong>r western regions.<br />
The curve is a typical western one and flatter than<br />
any eastern regional curve.<br />
While it was quite evident that <strong>the</strong> flood peak data <strong>for</strong><br />
some small catchments could <strong>not</strong> be tolerated in <strong>the</strong> derivation<br />
of a regional curve, it does appear from <strong>the</strong> Nor<strong>the</strong>rn<br />
North Island example that small catchments could possibly<br />
have been considered in <strong>the</strong> derivation of some of <strong>the</strong><br />
curves.<br />
3.6 Summary<br />
Eight flood frequency regions have been defined <strong>for</strong> New<br />
Zealand, and an average Q/Q vs T curve derived <strong>for</strong> each.<br />
It is suggested that <strong>the</strong>se regional curves can be used to estimate<br />
Qr/Q <strong>for</strong> rural catchments within <strong>the</strong> region concerned<br />
<strong>for</strong> return periods up to 200 years. An exception is<br />
<strong>the</strong> Otago-Southland curve; it is only tentative and should<br />
<strong>not</strong> be extrapolated beyond <strong>the</strong> 100-year return period. For<br />
return periods exceeding <strong>the</strong> recommended upper limit of<br />
<strong>the</strong> regional curve, one of <strong>the</strong> two generalised curves developed<br />
<strong>for</strong> <strong>the</strong> east and <strong>the</strong> west of New Zealand can aid<br />
<strong>the</strong> estimation of Q1/Q. With all <strong>the</strong> curves it is important<br />
that <strong>the</strong>y <strong>are</strong> <strong>not</strong> applied to catchments whose <strong>are</strong>as <strong>are</strong> too<br />
far outside <strong>the</strong> range of <strong>are</strong>as used in <strong>the</strong> derivation of <strong>the</strong><br />
curve concerned. An indication of <strong>the</strong> reliability of a Q1/Q<br />
estimate taken from a curve is provided by standard error<br />
equations, which give values somewhat less than a similar<br />
equation determined by NERC (1975) <strong>for</strong> use with <strong>the</strong> British<br />
Isles curves.<br />
The most <strong>not</strong>able characteristic of <strong>the</strong> curves is that those<br />
<strong>for</strong> <strong>the</strong> east have steeper slopes than those <strong>for</strong> <strong>the</strong> west, reflecting<br />
<strong>the</strong> greater variability in <strong>the</strong> annual flood peak data<br />
<strong>for</strong> <strong>the</strong> eastern catchments. The same characteristic is evident<br />
in <strong>the</strong> British Isles regional curves. Also of <strong>not</strong>e is that<br />
<strong>the</strong> two New Zealand generalised curves resemble <strong>the</strong>ir<br />
Great Britain counterparts (Stevens and Lynn 1978).<br />
52<br />
Water & soil technical publication no. 20 (1982)


