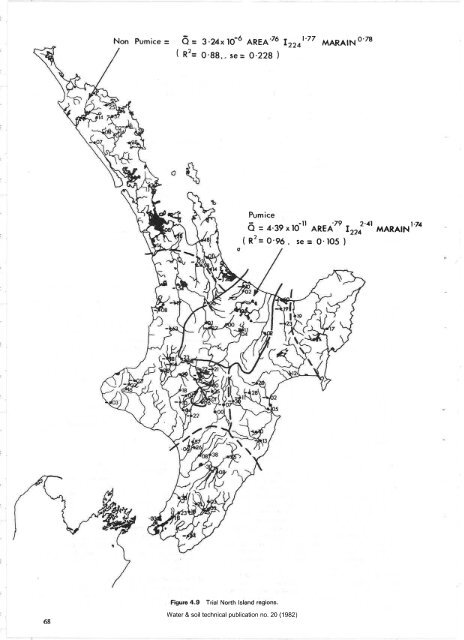
Table 4.8. Stepwise regressions <strong>for</strong> all North lsland data. No. Var. Name Coef br se of coef R2 se est Const log a Multiplier a 1 2 AREA AREA t224 AREA t224 MARAIN o.81 0.84 2.33 o.83 1.89 1.O7 o.o56 0.048 o.377 o.045 o.368 o.270 14.5 17.7 6.2 18.6 5.1 4.O 0.829 o.882 o.900 o.687 o.778 o.810 o.442 o.372 o.348 0.271 1 .87 -4.263 5.46 x 1O-õ - 6.862 1 .37 x 10' Table 4.9 Stepwise regressions <strong>for</strong> first trial North lsland regions Region Number Variable Variables Name Coef b' se of coef R2 se est Const Mult¡plier loga a Non-Pumice (84 catchments) 1 2 AREA AREA t224 AREA t224 MARAIN o.74 0.049 o.77 0.037 2.13 0.271 o.76 0.034 1.77 0.262 0.78 0. 1 91 '15.2 0.861 0.74 0.341 20.7 0.925 0.86 0.257 7.9 22.4 0.939 0.88 0.234 6.8 4.1 0.507 3.21 - 3.63 2.33 x 1O-a - 5.49 3.24 x 1O-o Pumice ( 1 2 catchments) 1 2 AREA AREA t224 AREA t224 MARAIN o.84 0.22 0.90 0.11 3.88 0.64 o.79 0.o9 2.41 0.73 1.74 0.64 3.8 0.765 8.5 0.958 6.1 8.9 0.978 3.3 2.7 o.59 0.359 -O.310 0.490 O.92 0.168 -7.806 1.56 x 1O-8 0.96 O.142 - 10.36 4.39 x 1Oi1 of which catchments lay within it, presented difficulty. Several catchments (<strong>for</strong> example 9101, Waitoa; 21803, Mohaka) have <strong>the</strong>ir headwaters in this pumice country, but most of <strong>the</strong>ir <strong>are</strong>as lie outside <strong>the</strong> pumice region. O<strong>the</strong>rs (e.g., 15410, Whirinaki) <strong>are</strong> mainly pumice but have a substantial <strong>are</strong>a outside <strong>the</strong> region. In still o<strong>the</strong>r catchments (those lying mainly on <strong>the</strong> slope of <strong>the</strong> central North Island volcanoes) <strong>the</strong> mantle of soil over rock is minimal and its hydrological influences were <strong>not</strong> known. After several trials, <strong>the</strong> pumice region was defined as comprehending three of <strong>the</strong> hydrological regions set out by Toebes and Palmer (1969). <strong>These</strong> were Taupo Pumice, Taupo Rhyolite, and East Raetihi which made up a discontinuous region including a total of 13 catchments, seven tributary to <strong>the</strong> Waikato River, four draining to <strong>the</strong> Bay of Plenty, and two tributary to <strong>the</strong> Wanganui River. Closer inspection of <strong>the</strong> data <strong>for</strong> <strong>the</strong>se l3 catchments showed that 11432108 (Purukohukohu) was a distinct outlier in having <strong>the</strong> smallest catchment <strong>are</strong>a and <strong>the</strong> least Q (by almost two orders of magnitude) <strong>for</strong> all 97 North Island catchments. For this reason, and because it was ephemeral, it was excluded from subsequent analyses. Taking two regions, pumice and non-pumice, trial regressions were undertaken. Stepwise results <strong>are</strong> given in Table 4.9 and <strong>the</strong> distribution of residual errors <strong>for</strong> <strong>the</strong> best fit equations is shown in Figure 4.9. This figure shows that within <strong>the</strong> pumice region <strong>the</strong> residuals seem randomly distributed with generally low values, but <strong>the</strong> remainder of <strong>the</strong> island contains very large residuals, some exceeding I 0.50. The sou<strong>the</strong>rn part of <strong>the</strong> island including tributary catchments to <strong>the</strong> lower Rangitikei, all <strong>the</strong> Manawatu, Wairarapa and Wellington <strong>are</strong>a catchments, have, with one small exception, positive residuals meaning that Qo5, <strong>for</strong> this <strong>are</strong>a is underestimated. Similarly, positive residuals occur over much of <strong>the</strong> Northland and Auckland <strong>are</strong>as. The fact that tropical cyclone events tend to produce flooding in this <strong>are</strong>a, and also <strong>the</strong> Coromandel and East Cape <strong>are</strong>as, may be a tentative basis <strong>for</strong> a region including <strong>the</strong>se <strong>are</strong>as. Negative residual values occur in <strong>the</strong> central part of <strong>the</strong> island outside <strong>the</strong> pumice region. This suggests a division of <strong>the</strong> Water & soil technical publication no. 20 (1982) island into four regions, and if <strong>the</strong> central part is divided between east and west coasts, into five regions, whose tentative boundaries <strong>are</strong> drawn dashed on Figure 4.9. <strong>These</strong> five regions <strong>are</strong> taken as a basis <strong>for</strong> fur<strong>the</strong>r study. A number of trials were undertaken with <strong>the</strong>se regions to determine where boundaries should be placed. Catchments which appe<strong>are</strong>d as outliers were checked, both <strong>for</strong> <strong>the</strong> correctness of data and <strong>for</strong> any features of <strong>the</strong> catchment which might influence flood peaks. Seven of <strong>the</strong> larger residuals could be attributed to special conditions of <strong>the</strong> catchment and were excluded from <strong>the</strong> final analysis. <strong>These</strong> were as follows: (i) C¡tchments with large ponding effects Serious over-estimates were made <strong>for</strong> Q <strong>for</strong> 9l0l (Waitoa) and 9108 (Piako). Two possible causes <strong>for</strong> this <strong>are</strong>, firslly that <strong>the</strong> headwaters <strong>for</strong> <strong>the</strong>se catchments lie in <strong>the</strong> pumice region, and secondly that <strong>the</strong> catchments have amongst <strong>the</strong> lowest channel slopes of all <strong>the</strong> North Island catchments, and have a very flat topography with peaty soils and swamps in <strong>the</strong> lower reaches. This second factor also causes attenuation of flood hydrographs. Thus <strong>the</strong>se two catchments were excluded frorn fur<strong>the</strong>r analysis. O<strong>the</strong>rs having large negative residuals in Figure 4.9 were 33307 (Wanganui at Headwaters) and 1143428 (Ohote); <strong>the</strong>se also were excluded on <strong>the</strong> basis that large parts of <strong>the</strong> catchments <strong>are</strong> swamps. (ii) C¡tchment in l¡mestone <strong>are</strong>a Catchment 40703 (Mangakowhai), which drains Waitomo limestone country, also had a large negative residual and was subsequently excluded on <strong>the</strong> basis that <strong>the</strong> catchment topographic <strong>are</strong>a may <strong>not</strong> be <strong>the</strong> true catchment <strong>are</strong>a. (iii) Catchment with short record Catchment 39508 (Manganui) had only four years of record. It was excluded on <strong>the</strong> basis that <strong>the</strong> estimate of Q may have excessive sampling error. 67
Non Pumice = õ = 3-24xto'6 AREA'7ó lr,o''" MARA|No'78 ( R2= 9.g3,- se= 0.228 I Pumice [ = a.39 ^ ro ll AREATe \r1'^' MARATNI'24 ( R'= O'9ó , se = O.lO5 ) Figure 4.9 Trial North lsland regions. 68 Water & soil technical publication no. 20 (1982)
- Page 1 and 2:
WATER & SOIL TECHNICAL PUBLICATION
- Page 3 and 4:
Regional flood est¡mat¡on in New
- Page 5 and 6:
Tables 1.1 Risk ofexceedence for sp
- Page 7 and 8:
Preface Water & soil technical publ
- Page 9 and 10:
annual flood Q (the mean of the ann
- Page 11 and 12:
Water & soil technical publication
- Page 13 and 14:
Doto ovoiloble on TIDEDA Figure 2'1
- Page 15 and 16:
P=45 O= 15 x4 (l) '= o o t.25 2'.O
- Page 17 and 18: Êv2 ( ko) Reduced Voriote y I'O t1
- Page 19 and 20: turn period. A plotting position fo
- Page 21 and 22: 'o ,l\, I zl l- I Water & soil tech
- Page 23 and 24: Table 3.2 Flow stat¡ons used. SITE
- Page 25 and 26: e process of examining the simtrend
- Page 27 and 28: Iì_ t_ I I I I I I I t-. I I tñ I
- Page 29 and 30: Þ I"IEST COFST 0 o I E 6o o o 25 3
- Page 31 and 32: SOUTHEBN REDUCEO Y VRBIßTE NETURN
- Page 33 and 34: SOUTH ISLFND HEST COFST I]ÊTR èo
- Page 35 and 36: SOUTH CÊNTERBURY DRTÊ NEOUCEO Y V
- Page 37 and 38: COMB I NED ,,IE5T CORST DRTR o rt
- Page 39 and 40: BÊY OF PLENTY DRTF o o o NEOUCEO Y
- Page 41 and 42: NOBTH ISLRND ßEGIONÊL CUBVES 1.50
- Page 43 and 44: data for this area are required bef
- Page 45 and 46: NELSON REGIONFL CURVE BEOUCEO Y VRR
- Page 47 and 48: 46 EÊSTEFìN NEI,,I ZEFLÊND DÊTI
- Page 49 and 50: Table 3.9 The grouping and the grou
- Page 51 and 52: allowing curves rather than just st
- Page 53 and 54: 3.5.5 Extension method The NERC (19
- Page 55 and 56: Table 4.1 South lsland catchment ch
- Page 57 and 58: I 2 t l¡ 5 5 7 I 9 l0 t1 ,12 I5 1{
- Page 59 and 60: decided instead to use estimates of
- Page 61 and 62: \Í l{ I t, ìj( Fþurc 4.4 Distrib
- Page 63 and 64: 62 Fþurc 4,6 Logarithmic rcsidual
- Page 65 and 66: Table 4.6 Final equations for South
- Page 67: I ++ ++ * E 4.6 Analysis of North l
- Page 71 and 72: Northlond f C"ro^ondel f Eost Cope
- Page 73 and 74: Table 4.11 Comparable equations for
- Page 75 and 76: Poo led cv Pooled o.40 F¡guro 4.12
- Page 77 and 78: mates of Cp typically range between
- Page 79 and 80: -J æ 'll o Eo !¡ Assemble llood p
- Page 81 and 82: Year 1958 1959 1960 l96r t962 1963
- Page 83 and 84: The estimate of Q from the regional
- Page 85 and 86: Water & soil technical publication
- Page 87 and 88: Maguiness, J.A.; Blackwood, P.L.; B
- Page 89 and 90: The liequency factor K is a functio
- Page 91 and 92: e.9., Linsley et ol. (1915); lrish
- Page 93 and 94: Maguiness, J.A.; Blackwood, P.L.; B
- Page 95 and 96: sltt 930 t [rûltRÀict ¡ l? s;¡t
- Page 97 and 98: 3950't flrlÀRt R tr îlt¡Ît ;tP
- Page 99 and 100: S ITI 29202 RuNttiltcl I ¡t tllEtt
- Page 101 and 102: ïI-'_____ ::19: lt¡IPt0r n À1 i
- Page 103 and 104: 9100r GNE? R ¡T DOBSO| s¡18 93207
- Page 105 and 106: 6800 1 sBlrri R tT SrITEC¡,tttS 6I
- Page 107 and 108: APPENDIX C Summary of tho data for
- Page 109 and 110: oæ ON LAT. STATION NA ATION LAT. N
- Page 111 and 112: o NUI,IBER HHAKAIIARU 854801 38 L7'
- Page 113 and 114: l9 AT NU¡IB ËR AR',tËtlANA ÂRAI
- Page 115 and 116: A ON LAT. STATION NA NUMBER AHUNA 5
- Page 117 and 118: â NUI,IBER Lü{G.E ON NU14EER I,IU
- Page 119 and 120:
æ TATI ¡rouNT sor.tERS 7L740? 43
- Page 121 and 122:
N) o STATIoN NAr{gmLfï3---ffij NUI
- Page 123 and 124:
APPENDIX E Compadson of Regional Fl
- Page 125 and 126:
Table F.2 Flood peak data. NEW OTAG
- Page 127 and 128:
F.3 Analysis and results tatively p
- Page 129 and 130:
ét êt REOUCEO VßFIHTE 2. 33 5 l0
- Page 131 and 132:
SOLITH I EA l') COAST soUTH CANTERB
- Page 133 and 134:
0tiftflt a itÉitut5 ü¡. il/5 tg?
- Page 135:
Water & soil technical publication