WP6-Brochure-E4 brochure - ELA European Lift Association.
WP6-Brochure-E4 brochure - ELA European Lift Association.
WP6-Brochure-E4 brochure - ELA European Lift Association.

You also want an ePaper? Increase the reach of your titles
YUMPU automatically turns print PDFs into web optimized ePapers that Google loves.
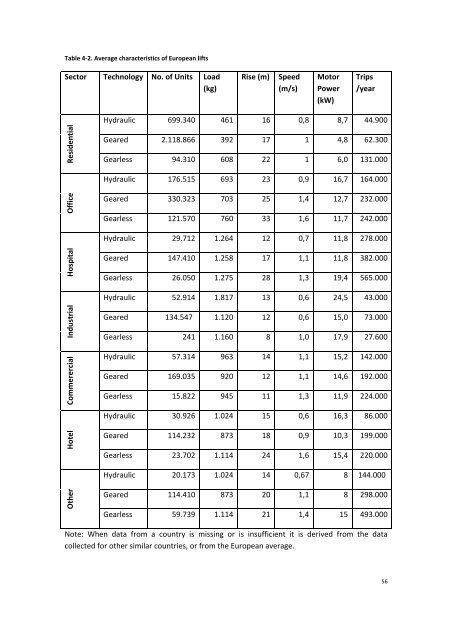
Table 4‐2. Average characteristics of <strong>European</strong> lifts<br />
Sector Technology No. of Units Load<br />
(kg)<br />
Rise (m)<br />
Speed<br />
(m/s)<br />
Motor<br />
Power<br />
(kW)<br />
Trips<br />
/year<br />
Residential<br />
Hydraulic 699.340 461 16 0,8 8,7 44.900<br />
Geared 2.118.866 392 17 1 4,8 62.300<br />
Gearless 94.310 608 22 1 6,0 131.000<br />
Hydraulic 176.515 693 23 0,9 16,7 164.000<br />
Office<br />
Geared 330.323 703 25 1,4 12,7 232.000<br />
Gearless 121.570 760 33 1,6 11,7 242.000<br />
Hydraulic 29.712 1.264 12 0,7 11,8 278.000<br />
Hospital<br />
Geared 147.410 1.258 17 1,1 11,8 382.000<br />
Gearless 26.050 1.275 28 1,3 19,4 565.000<br />
Hydraulic 52.914 1.817 13 0,6 24,5 43.000<br />
Industrial<br />
Commerercial<br />
Geared 134.547 1.120 12 0,6 15,0 73.000<br />
Gearless 241 1.160 8 1,0 17,9 27.600<br />
Hydraulic 57.314 963 14 1,1 15,2 142.000<br />
Geared 169.035 920 12 1,1 14,6 192.000<br />
Gearless 15.822 945 11 1,3 11,9 224.000<br />
Hydraulic 30.926 1.024 15 0,6 16,3 86.000<br />
Hotel<br />
Geared 114.232 873 18 0,9 10,3 199.000<br />
Gearless 23.702 1.114 24 1,6 15,4 220.000<br />
Hydraulic 20.173 1.024 14 0,67 8 144.000<br />
Other<br />
Geared 114.410 873 20 1,1 8 298.000<br />
Gearless 59.739 1.114 21 1,4 15 493.000<br />
Note: When data from a country is missing or is insufficient it is derived from the data<br />
collected for other similar countries, or from the <strong>European</strong> average.<br />
56