Annual Report 2011 - T-Hrvatski Telekom
Annual Report 2011 - T-Hrvatski Telekom
Annual Report 2011 - T-Hrvatski Telekom

Create successful ePaper yourself
Turn your PDF publications into a flip-book with our unique Google optimized e-Paper software.
93<br />
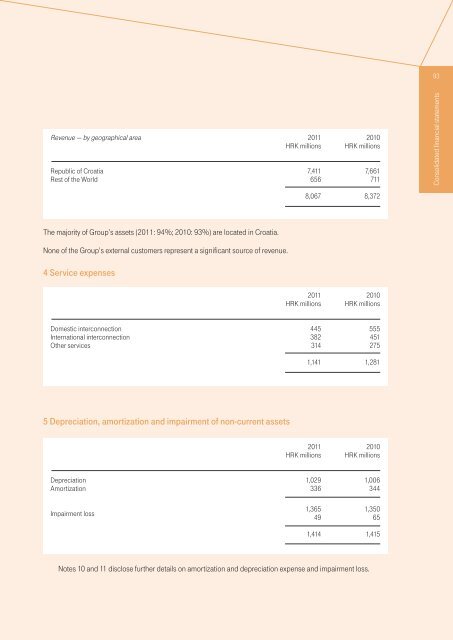
Revenue — by geographical area<br />
Republic of Croatia<br />
Rest of the World<br />
<strong>2011</strong><br />
HRK millions<br />
7,411<br />
656<br />
2010<br />
HRK millions<br />
7,661<br />
711<br />
Consolidated financial statements<br />
8,067<br />
8,372<br />
The majority of Group’s assets (<strong>2011</strong>: 94%; 2010: 93%) are located in Croatia.<br />
None of the Group’s external customers represent a significant source of revenue.<br />
4 Service expenses<br />
<strong>2011</strong><br />
HRK millions<br />
2010<br />
HRK millions<br />
Domestic interconnection<br />
International interconnection<br />
Other services<br />
445<br />
382<br />
314<br />
1,141<br />
555<br />
451<br />
275<br />
1,281<br />
5 Depreciation, amortization and impairment of non-current assets<br />
<strong>2011</strong><br />
HRK millions<br />
2010<br />
HRK millions<br />
Depreciation<br />
Amortization<br />
Impairment loss<br />
1,029<br />
336<br />
1,365<br />
49<br />
1,414<br />
1,006<br />
344<br />
1,350<br />
65<br />
1,415<br />
Notes 10 and 11 disclose further details on amortization and depreciation expense and impairment loss.