new characteristics of inequalities in the information society and ...
new characteristics of inequalities in the information society and ...
new characteristics of inequalities in the information society and ...

You also want an ePaper? Increase the reach of your titles
YUMPU automatically turns print PDFs into web optimized ePapers that Google loves.
ISSN: 2247-6172;<br />
ISSN-L: 2247-6172<br />
Review <strong>of</strong> Applied Socio- Economic Research<br />
(Volume 5, Issue 1/ 2013 ), pp. 182<br />
URL: http://www.reaser.eu<br />
e-mail: editors@reaser.eu<br />
3. Network topology <strong>and</strong> structural dynamics (1952-2011)<br />
The m<strong>in</strong>imum spann<strong>in</strong>g tree approach is based <strong>in</strong> <strong>the</strong> conditional correlation matrix, focus<strong>in</strong>g on <strong>the</strong><br />
correlation patterns <strong>of</strong> <strong>in</strong>teractions between economies. Interactions comb<strong>in</strong>ations result <strong>in</strong> graphs with<br />
different degrees <strong>of</strong> complexity, constructed by iteratively l<strong>in</strong>k<strong>in</strong>g <strong>the</strong> most strongly connected economies<br />
(nodes). In this section I firstly present a static representation <strong>of</strong> <strong>the</strong> average structure <strong>of</strong> <strong>the</strong> network over <strong>the</strong><br />
period <strong>and</strong> <strong>the</strong>n I exam<strong>in</strong>e its stability <strong>and</strong> robustness dynamics.<br />
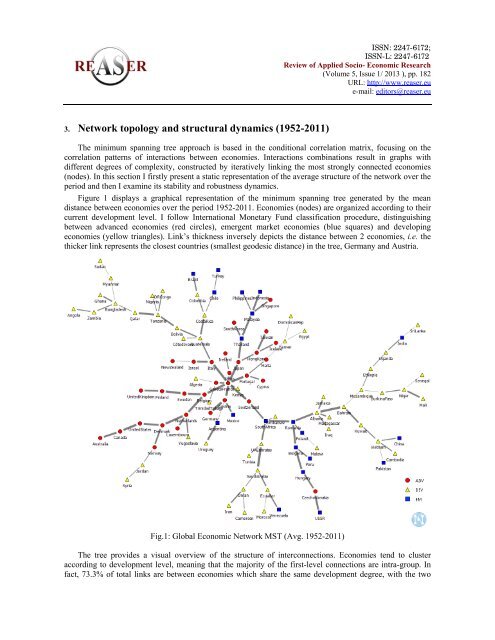
Figure 1 displays a graphical representation <strong>of</strong> <strong>the</strong> m<strong>in</strong>imum spann<strong>in</strong>g tree generated by <strong>the</strong> mean<br />
distance between economies over <strong>the</strong> period 1952-2011. Economies (nodes) are organized accord<strong>in</strong>g to <strong>the</strong>ir<br />
current development level. I follow International Monetary Fund classification procedure, dist<strong>in</strong>guish<strong>in</strong>g<br />
between advanced economies (red circles), emergent market economies (blue squares) <strong>and</strong> develop<strong>in</strong>g<br />
economies (yellow triangles). L<strong>in</strong>k’s thickness <strong>in</strong>versely depicts <strong>the</strong> distance between 2 economies, i.e. <strong>the</strong><br />
thicker l<strong>in</strong>k represents <strong>the</strong> closest countries (smallest geodesic distance) <strong>in</strong> <strong>the</strong> tree, Germany <strong>and</strong> Austria.<br />
Fig.1: Global Economic Network MST (Avg. 1952-2011)<br />
The tree provides a visual overview <strong>of</strong> <strong>the</strong> structure <strong>of</strong> <strong>in</strong>terconnections. Economies tend to cluster<br />
accord<strong>in</strong>g to development level, mean<strong>in</strong>g that <strong>the</strong> majority <strong>of</strong> <strong>the</strong> first-level connections are <strong>in</strong>tra-group. In<br />
fact, 73.3% <strong>of</strong> total l<strong>in</strong>ks are between economies which share <strong>the</strong> same development degree, with <strong>the</strong> two