MORE GUIDANCE, BETTER RESULTS?
MORE GUIDANCE, BETTER RESULTS?
MORE GUIDANCE, BETTER RESULTS?
Create successful ePaper yourself
Turn your PDF publications into a flip-book with our unique Google optimized e-Paper software.
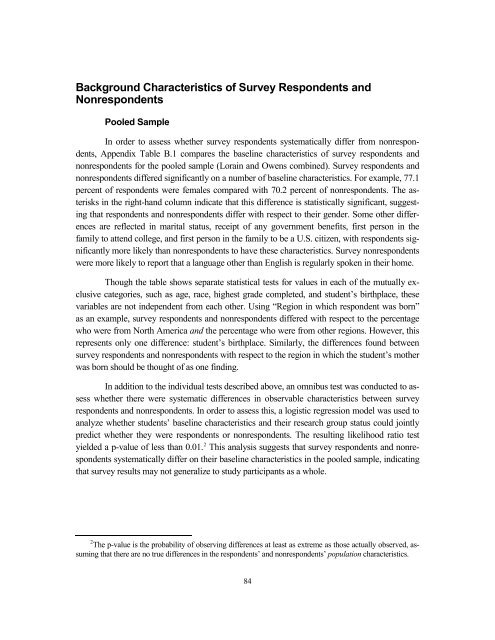
Background Characteristics of Survey Respondents andNonrespondentsPooled SampleIn order to assess whether survey respondents systematically differ from nonrespondents,Appendix Table B.1 compares the baseline characteristics of survey respondents andnonrespondents for the pooled sample (Lorain and Owens combined). Survey respondents andnonrespondents differed significantly on a number of baseline characteristics. For example, 77.1percent of respondents were females compared with 70.2 percent of nonrespondents. The asterisksin the right-hand column indicate that this difference is statistically significant, suggestingthat respondents and nonrespondents differ with respect to their gender. Some other differencesare reflected in marital status, receipt of any government benefits, first person in thefamily to attend college, and first person in the family to be a U.S. citizen, with respondents significantlymore likely than nonrespondents to have these characteristics. Survey nonrespondentswere more likely to report that a language other than English is regularly spoken in their home.Though the table shows separate statistical tests for values in each of the mutually exclusivecategories, such as age, race, highest grade completed, and student’s birthplace, thesevariables are not independent from each other. Using “Region in which respondent was born”as an example, survey respondents and nonrespondents differed with respect to the percentagewho were from North America and the percentage who were from other regions. However, thisrepresents only one difference: student’s birthplace. Similarly, the differences found betweensurvey respondents and nonrespondents with respect to the region in which the student’s motherwas born should be thought of as one finding.In addition to the individual tests described above, an omnibus test was conducted to assesswhether there were systematic differences in observable characteristics between surveyrespondents and nonrespondents. In order to assess this, a logistic regression model was used toanalyze whether students’ baseline characteristics and their research group status could jointlypredict whether they were respondents or nonrespondents. The resulting likelihood ratio testyielded a p-value of less than 0.01. 2 This analysis suggests that survey respondents and nonrespondentssystematically differ on their baseline characteristics in the pooled sample, indicatingthat survey results may not generalize to study participants as a whole.2 The p-value is the probability of observing differences at least as extreme as those actually observed, assumingthat there are no true differences in the respondents’ and nonrespondents’ population characteristics.84


