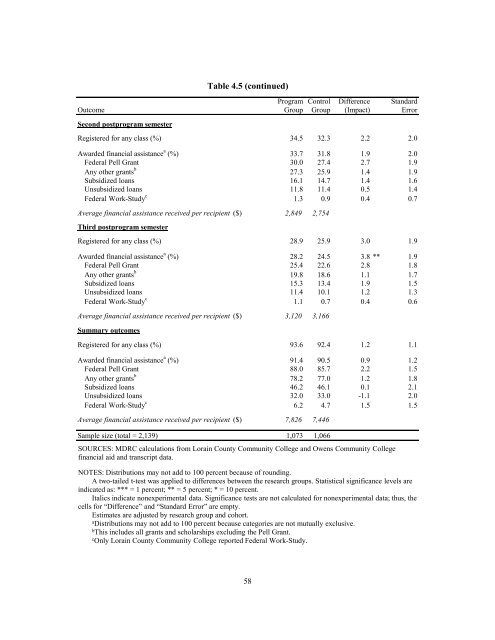
Program Control Difference StandardOutcome Group Group (Impact) ErrorSecond postprogram semesterRegistered for any class (%) 34.5 32.3 2.2 2.0Awarded financial assistance a (%) 33.7 31.8 1.9 2.0Federal Pell Grant 30.0 27.4 2.7 1.9Any other grants b 27.3 25.9 1.4 1.9Subsidized loans 16.1 14.7 1.4 1.6Unsubsidized loans 11.8 11.4 0.5 1.4Federal Work-Study c 1.3 0.9 0.4 0.7Average financial assistance received per recipient ($) 2,849 2,754Third postprogram semesterRegistered for any class (%) 28.9 25.9 3.0 1.9Awarded financial assistance a (%) 28.2 24.5 3.8 ** 1.9Federal Pell Grant 25.4 22.6 2.8 1.8Any other grants b 19.8 18.6 1.1 1.7Subsidized loans 15.3 13.4 1.9 1.5Unsubsidized loans 11.4 10.1 1.2 1.3Federal Work-Study c 1.1 0.7 0.4 0.6Average financial assistance received per recipient ($) 3,120 3,166Summary outcomesTable 4.5 (continued)Registered for any class (%) 93.6 92.4 1.2 1.1Awarded financial assistance a (%) 91.4 90.5 0.9 1.2Federal Pell Grant 88.0 85.7 2.2 1.5Any other grants b 78.2 77.0 1.2 1.8Subsidized loans 46.2 46.1 0.1 2.1Unsubsidized loans 32.0 33.0 -1.1 2.0Federal Work-Study c 6.2 4.7 1.5 1.5Average financial assistance received per recipient ($) 7,826 7,446Sample size (total = 2,139) 1,073 1,066SOURCES: MDRC calculations from Lorain County Community College and Owens Community Collegefinancial aid and transcript data.NOTES: Distributions may not add to 100 percent because of rounding.A two-tailed t-test was applied to differences between the research groups. Statistical significance levels areindicated as: *** = 1 percent; ** = 5 percent; * = 10 percent.Italics indicate nonexperimental data. Significance tests are not calculated for nonexperimental data; thus, thecells for “Difference” and “Standard Error” are empty.Estimates are adjusted by research group and cohort.aDistributions may not add to 100 percent because categories are not mutually exclusive.bThis includes all grants and scholarships excluding the Pell Grant.cOnly Lorain County Community College reported Federal Work-Study.58
correspond with the program’s impact on registration. It cannot be determined with certaintywhether students chose to register because they would be able to receive financial assistance, orwhether students obtained financial assistance once they decided to register for another semester.While the program’s generally positive impact on the receipt of financial assistancemay be a result of its impact on registration, there is evidence that advising on financial mattersmade a difference above and beyond the program’s impact on registration. Despite the fact thata higher percentage of program group students registered during the second program semester,they were actually less likely to be awarded unsubsidized loans. This can be viewed as apositive impact since, compared with other forms of financial assistance (grants and subsidizedloans), unsubsidized loans are generally considered the least desirable form of financial assistance.So, there is some evidence that the program’s enhanced advising on financial mattersmade a small impact.The program’s impacts on financial aid at Lorain and at Owens were generally similar.(See Appendix Table E.8.)Effects on Social, Psychological, and Health OutcomesThe Opening Doors program discussed in this report was mainly intended to have a positiveimpact on students’ chances of academic success. Positive program impacts on measures ofacademic success such as retention, earned credits, or college completion have the potential toinfluence broader life outcomes, such as improved social, psychological, and health outcomes. 7While impacts on these measures of well-being are more likely to occur over the longer term,data from the study’s 12-month survey may indicate whether the program demonstrates any earlyimpacts on students’ well-being. Before considering the program’s impacts on these measures ofwell-being, a descriptive profile of study participants’ social, psychological, and health statuses atbaseline (that is, at the point of random assignment) is provided.Among study participants, more than half had a Body Mass Index (BMI) that placesthem in the overweight category according to standard weight-status categories. (See AppendixTable E.9.) In addition, over one-third of sample members considered themselves to be “currentsmokers” at baseline. Although being overweight and smoking are generally associated withpoor health status, less than 1 in 13 sample members viewed themselves as being in fair or poorhealth. Nevertheless, at baseline this group appears to have had health challenges.7 For a detailed explanation of how positive impacts on education outcomes can influence broader life outcomes,see Scrivener et al. (2008), 73-76.59
- Page 1:
OPENING DOORSMORE GUIDANCE,BETTER R
- Page 4 and 5:
Funders of the Opening Doors Projec
- Page 7 and 8:
ContentsOverviewList of Tables, Fig
- Page 9 and 10:
List of Tables, Figures, and BoxesT
- Page 11:
PrefaceIf approved by Congress, the
- Page 14 and 15:
guidance on the study. Thomas Brock
- Page 16 and 17:
• The Ohio colleges successfully
- Page 18 and 19:
Program group members were assigned
- Page 20 and 21:
• For the most part, the program
- Page 22 and 23:
offered, but might also provide stu
- Page 25 and 26:
Chapter 1IntroductionOver the last
- Page 27 and 28:
The Opening Doors DemonstrationTabl
- Page 29 and 30:
sure that students complete the req
- Page 31 and 32: While the mechanism through which s
- Page 33 and 34: imately 1,700 to 1 in 2001. 22 Exac
- Page 35: of literature exist on career couns
- Page 38 and 39: The CollegeLorain County Community
- Page 40 and 41: • Were beginning freshmen or cont
- Page 42 and 43: The Opening Doors DemonstrationTabl
- Page 44 and 45: Table 2.1 (continued)SOURCE: MDRC c
- Page 46 and 47: Lorain and Owens Financial Aid Data
- Page 49 and 50: Chapter 3The Implementation of the
- Page 51 and 52: Toward the end of each student’s
- Page 53 and 54: meet with their counselor a minimum
- Page 55: The Opening Doors DemonstrationTabl
- Page 59 and 60: Appendix Table C.2 shows informatio
- Page 61: Opening Doors counselors, and progr
- Page 64 and 65: Program Control Difference Standard
- Page 67 and 68: Chapter 4The Effects of Enhanced St
- Page 69 and 70: Program SemestersTable 4.1 (page 47
- Page 71 and 72: Program Control Difference Standard
- Page 73 and 74: Program Control Difference Standard
- Page 75 and 76: The Opening Doors DemonstrationTabl
- Page 77 and 78: Transcript Outcomes by GenderAssess
- Page 79 and 80: Program Control Difference Standard
- Page 81: Program Control Difference Standard
- Page 85 and 86: Chapter 5Summary and ConclusionsLor
- Page 87 and 88: The Opening Doors DemonstrationFigu
- Page 89 and 90: An alternative interpretation of th
- Page 91: Appendix ASupplementary Baseline In
- Page 94 and 95: Full Program ControlCharacteristic
- Page 96 and 97: Appendix Table A.1 (continued)Full
- Page 98 and 99: Full Program ControlCharacteristic
- Page 100 and 101: Appendix Table A.2 (continued)Full
- Page 102 and 103: Appendix Table A.3 (continued)Full
- Page 105: Appendix BSurvey Response Analysis
- Page 108 and 109: Background Characteristics of Surve
- Page 110 and 111: Table B.1 (continued)Characteristic
- Page 112 and 113: The Opening Doors DemonstrationAppe
- Page 114 and 115: Table B.2 (continued)SOURCE: MDRC c
- Page 116 and 117: Table B.3 (continued)Characteristic
- Page 118 and 119: The Opening Doors DemonstrationAppe
- Page 120 and 121: Table B.4 (continued)SOURCE: MDRC c
- Page 122 and 123: Table B.5 (continued)Characteristic
- Page 124 and 125: The Opening Doors DemonstrationAppe
- Page 126 and 127: Table B.6 (continued)SOURCE: MDRC c
- Page 129 and 130: Lorain OwensProgram ProgramOutcome
- Page 131 and 132: Lorain County Community CollegeOwen
- Page 133:
Appendix DDescription of Scales Pre
- Page 136 and 137:
4. I hardly ever expect things to g
- Page 138 and 139:
Social Support and Civic Engagement
- Page 140 and 141:
Psychological Distress (6-item summ
- Page 143 and 144:
Lorain County Community CollegeOwen
- Page 145 and 146:
Lorain County Community CollegeOwen
- Page 147 and 148:
Lorain County Community CollegeOwen
- Page 149 and 150:
Male SubgroupFemale SubgroupDiffere
- Page 151 and 152:
Male SubgroupFemale SubgroupDiffere
- Page 153 and 154:
Male SubgroupFemale SubgroupDiffere
- Page 155 and 156:
Lorain County Community CollegeOwen
- Page 157 and 158:
Appendix Table E.7 (continued)SOURC
- Page 159 and 160:
Lorain County Community CollegeOwen
- Page 161 and 162:
The Opening Doors DemonstrationAppe
- Page 163 and 164:
Appendix Table E.10 (continued)SOUR
- Page 165 and 166:
ReferencesAdelman, Clifford. 2004.
- Page 167 and 168:
EARLIER MDRC PUBLICATIONS ON OPENIN
- Page 169:
About MDRCMDRC is a nonprofit, nonp