MORE GUIDANCE, BETTER RESULTS?
MORE GUIDANCE, BETTER RESULTS?
MORE GUIDANCE, BETTER RESULTS?

You also want an ePaper? Increase the reach of your titles
YUMPU automatically turns print PDFs into web optimized ePapers that Google loves.
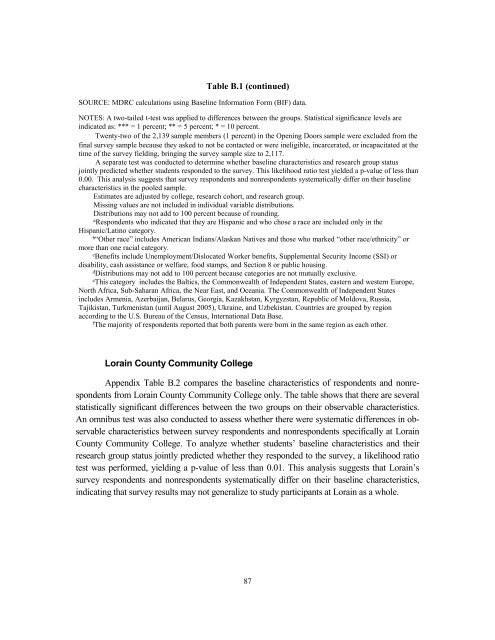
Table B.1 (continued)SOURCE: MDRC calculations using Baseline Information Form (BIF) data.NOTES: A two-tailed t-test was applied to differences between the groups. Statistical significance levels areindicated as: *** = 1 percent; ** = 5 percent; * = 10 percent.Twenty-two of the 2,139 sample members (1 percent) in the Opening Doors sample were excluded from thefinal survey sample because they asked to not be contacted or were ineligible, incarcerated, or incapacitated at thetime of the survey fielding, bringing the survey sample size to 2,117.A separate test was conducted to determine whether baseline characteristics and research group statusjointly predicted whether students responded to the survey. This likelihood ratio test yielded a p-value of less than0.00. This analysis suggests that survey respondents and nonrespondents systematically differ on their baselinecharacteristics in the pooled sample.Estimates are adjusted by college, research cohort, and research group.Missing values are not included in individual variable distributions.Distributions may not add to 100 percent because of rounding.aRespondents who indicated that they are Hispanic and who chose a race are included only in theHispanic/Latino category.b“Other race” includes American Indians/Alaskan Natives and those who marked “other race/ethnicity” ormore than one racial category.cBenefits include Unemployment/Dislocated Worker benefits, Supplemental Security Income (SSI) ordisability, cash assistance or welfare, food stamps, and Section 8 or public housing.dDistributions may not add to 100 percent because categories are not mutually exclusive.eThis category includes the Baltics, the Commonwealth of Independent States, eastern and western Europe,North Africa, Sub-Saharan Africa, the Near East, and Oceania. The Commonwealth of Independent Statesincludes Armenia, Azerbaijan, Belarus, Georgia, Kazakhstan, Kyrgyzstan, Republic of Moldova, Russia,Tajikistan, Turkmenistan (until August 2005), Ukraine, and Uzbekistan. Countries are grouped by regionaccording to the U.S. Bureau of the Census, International Data Base.fThe majority of respondents reported that both parents were born in the same region as each other.Lorain County Community CollegeAppendix Table B.2 compares the baseline characteristics of respondents and nonrespondentsfrom Lorain County Community College only. The table shows that there are severalstatistically significant differences between the two groups on their observable characteristics.An omnibus test was also conducted to assess whether there were systematic differences in observablecharacteristics between survey respondents and nonrespondents specifically at LorainCounty Community College. To analyze whether students’ baseline characteristics and theirresearch group status jointly predicted whether they responded to the survey, a likelihood ratiotest was performed, yielding a p-value of less than 0.01. This analysis suggests that Lorain’ssurvey respondents and nonrespondents systematically differ on their baseline characteristics,indicating that survey results may not generalize to study participants at Lorain as a whole.87