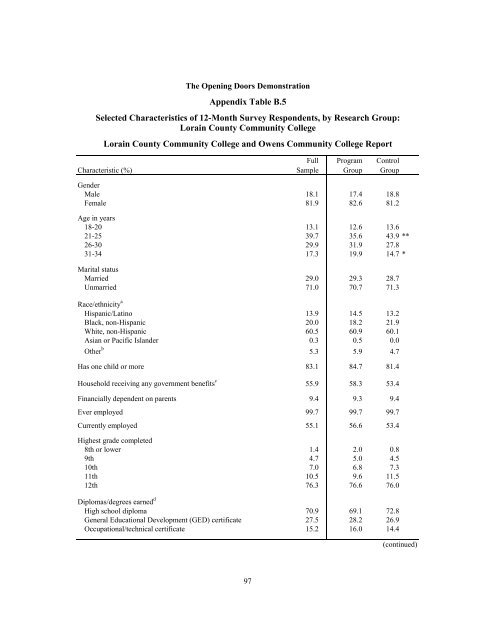
Table B.4 (continued)SOURCE: MDRC calculations using Baseline Information Form (BIF) data.NOTES: A two-tailed t-test was applied to differences between the groups. Statistical significance levels areindicated as: *** = 1 percent; ** = 5 percent; * = 10 percent.A separate test was conducted to determine whether baseline characteristics jointly predicted researchgroup status among survey respondents. This likelihood ratio test yielded a p-value of 0.03. This analysissuggests that program group survey respondents and control group survey respondents systematically differ ontheir baseline characteristics in the pooled sample.Estimates are adjusted by college and research cohort.Missing values are not included in individual variable distributions.Distributions may not add to 100 percent because of rounding.aRespondents who indicated that they are Hispanic and who chose a race are included only in theHispanic/Latino category.b“Other race” includes American Indians/Alaskan Natives and those who marked “other race/ethnicity” ormore than one racial category.cBenefits include Unemployment/Dislocated Worker benefits, Supplemental Security Income (SSI) ordisability, cash assistance or welfare, food stamps, and Section 8 or public housing.dDistributions may not add to 100 percent because categories are not mutually exclusive.eThis category includes the Baltics, the Commonwealth of Independent States, eastern and western Europe,North Africa, Sub-Saharan Africa, the Near East, and Oceania. The Commonwealth of Independent Statesincludes Armenia, Azerbaijan, Belarus, Georgia, Kazakhstan, Kyrgyzstan, Republic of Moldova, Russia,Tajikistan, Turkmenistan (until August 2005), Ukraine, and Uzbekistan. Countries are grouped by regionaccording to the U.S. Bureau of the Census, International Data Base.fThe majority of respondents reported that both parents were born in the same region as each other.In addition to the individual tests described above, an omnibus test was conducted to assesswhether there were systematic differences in observable characteristics between programand control group survey respondents. To assess whether survey respondents’ baseline characteristicsjointly predicted their research group status, a likelihood ratio test was performed,yielding a p-value of 0.03. This analysis suggests that program group survey respondents andcontrol group survey respondents systematically differ on their baseline characteristics in thepooled sample. As a result, when conducting impact analyses on the pooled survey data, statisticaladjustments were made for several key variables on which program and control groupmembers differed at baseline. All such analyses yielded substantively similar results to analysesconducted without controls, so results presented do not control for any baseline characteristics.Lorain County Community CollegeAppendix Table B.5 compares the baseline characteristics of program group surveyrespondents to control group survey respondents from Lorain County Community College only.The table shows that there are several statistically significant differences between the twogroups on their observable characteristics. To assess whether survey respondents’ baseline characteristicsjointly predicted their research group status specifically at Lorain County Community96
The Opening Doors DemonstrationAppendix Table B.5Selected Characteristics of 12-Month Survey Respondents, by Research Group:Lorain County Community CollegeLorain County Community College and Owens Community College ReportCharacteristic (%)Full Program ControlSample Group GroupGenderMale 18.1 17.4 18.8Female 81.9 82.6 81.2Age in years18-20 13.1 12.6 13.621-25 39.7 35.6 43.9 **26-30 29.9 31.9 27.831-34 17.3 19.9 14.7 *Marital statusMarried 29.0 29.3 28.7Unmarried 71.0 70.7 71.3Race/ethnicity aHispanic/Latino 13.9 14.5 13.2Black, non-Hispanic 20.0 18.2 21.9White, non-Hispanic 60.5 60.9 60.1Asian or Pacific Islander 0.3 0.5 0.0Other b 5.3 5.9 4.7Has one child or more 83.1 84.7 81.4Household receiving any government benefits c 55.9 58.3 53.4Financially dependent on parents 9.4 9.3 9.4Ever employed 99.7 99.7 99.7Currently employed 55.1 56.6 53.4Highest grade completed8th or lower 1.4 2.0 0.89th 4.7 5.0 4.510th 7.0 6.8 7.311th 10.5 9.6 11.512th 76.3 76.6 76.0Diplomas/degrees earned dHigh school diploma 70.9 69.1 72.8General Educational Development (GED) certificate 27.5 28.2 26.9Occupational/technical certificate 15.2 16.0 14.4(continued)97
- Page 1:
OPENING DOORSMORE GUIDANCE,BETTER R
- Page 4 and 5:
Funders of the Opening Doors Projec
- Page 7 and 8:
ContentsOverviewList of Tables, Fig
- Page 9 and 10:
List of Tables, Figures, and BoxesT
- Page 11:
PrefaceIf approved by Congress, the
- Page 14 and 15:
guidance on the study. Thomas Brock
- Page 16 and 17:
• The Ohio colleges successfully
- Page 18 and 19:
Program group members were assigned
- Page 20 and 21:
• For the most part, the program
- Page 22 and 23:
offered, but might also provide stu
- Page 25 and 26:
Chapter 1IntroductionOver the last
- Page 27 and 28:
The Opening Doors DemonstrationTabl
- Page 29 and 30:
sure that students complete the req
- Page 31 and 32:
While the mechanism through which s
- Page 33 and 34:
imately 1,700 to 1 in 2001. 22 Exac
- Page 35:
of literature exist on career couns
- Page 38 and 39:
The CollegeLorain County Community
- Page 40 and 41:
• Were beginning freshmen or cont
- Page 42 and 43:
The Opening Doors DemonstrationTabl
- Page 44 and 45:
Table 2.1 (continued)SOURCE: MDRC c
- Page 46 and 47:
Lorain and Owens Financial Aid Data
- Page 49 and 50:
Chapter 3The Implementation of the
- Page 51 and 52:
Toward the end of each student’s
- Page 53 and 54:
meet with their counselor a minimum
- Page 55:
The Opening Doors DemonstrationTabl
- Page 59 and 60:
Appendix Table C.2 shows informatio
- Page 61:
Opening Doors counselors, and progr
- Page 64 and 65:
Program Control Difference Standard
- Page 67 and 68:
Chapter 4The Effects of Enhanced St
- Page 69 and 70: Program SemestersTable 4.1 (page 47
- Page 71 and 72: Program Control Difference Standard
- Page 73 and 74: Program Control Difference Standard
- Page 75 and 76: The Opening Doors DemonstrationTabl
- Page 77 and 78: Transcript Outcomes by GenderAssess
- Page 79 and 80: Program Control Difference Standard
- Page 81 and 82: Program Control Difference Standard
- Page 83 and 84: correspond with the program’s imp
- Page 85 and 86: Chapter 5Summary and ConclusionsLor
- Page 87 and 88: The Opening Doors DemonstrationFigu
- Page 89 and 90: An alternative interpretation of th
- Page 91: Appendix ASupplementary Baseline In
- Page 94 and 95: Full Program ControlCharacteristic
- Page 96 and 97: Appendix Table A.1 (continued)Full
- Page 98 and 99: Full Program ControlCharacteristic
- Page 100 and 101: Appendix Table A.2 (continued)Full
- Page 102 and 103: Appendix Table A.3 (continued)Full
- Page 105: Appendix BSurvey Response Analysis
- Page 108 and 109: Background Characteristics of Surve
- Page 110 and 111: Table B.1 (continued)Characteristic
- Page 112 and 113: The Opening Doors DemonstrationAppe
- Page 114 and 115: Table B.2 (continued)SOURCE: MDRC c
- Page 116 and 117: Table B.3 (continued)Characteristic
- Page 118 and 119: The Opening Doors DemonstrationAppe
- Page 122 and 123: Table B.5 (continued)Characteristic
- Page 124 and 125: The Opening Doors DemonstrationAppe
- Page 126 and 127: Table B.6 (continued)SOURCE: MDRC c
- Page 129 and 130: Lorain OwensProgram ProgramOutcome
- Page 131 and 132: Lorain County Community CollegeOwen
- Page 133: Appendix DDescription of Scales Pre
- Page 136 and 137: 4. I hardly ever expect things to g
- Page 138 and 139: Social Support and Civic Engagement
- Page 140 and 141: Psychological Distress (6-item summ
- Page 143 and 144: Lorain County Community CollegeOwen
- Page 145 and 146: Lorain County Community CollegeOwen
- Page 147 and 148: Lorain County Community CollegeOwen
- Page 149 and 150: Male SubgroupFemale SubgroupDiffere
- Page 151 and 152: Male SubgroupFemale SubgroupDiffere
- Page 153 and 154: Male SubgroupFemale SubgroupDiffere
- Page 155 and 156: Lorain County Community CollegeOwen
- Page 157 and 158: Appendix Table E.7 (continued)SOURC
- Page 159 and 160: Lorain County Community CollegeOwen
- Page 161 and 162: The Opening Doors DemonstrationAppe
- Page 163 and 164: Appendix Table E.10 (continued)SOUR
- Page 165 and 166: ReferencesAdelman, Clifford. 2004.
- Page 167 and 168: EARLIER MDRC PUBLICATIONS ON OPENIN
- Page 169: About MDRCMDRC is a nonprofit, nonp