MORE GUIDANCE, BETTER RESULTS?
MORE GUIDANCE, BETTER RESULTS?
MORE GUIDANCE, BETTER RESULTS?

Create successful ePaper yourself
Turn your PDF publications into a flip-book with our unique Google optimized e-Paper software.
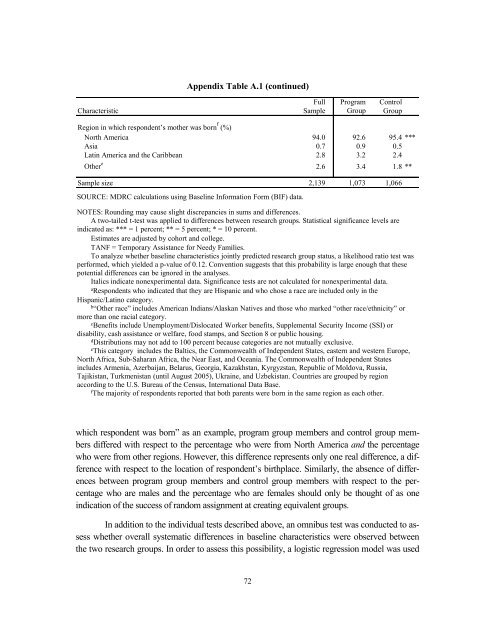
Appendix Table A.1 (continued)Full Program ControlCharacteristic Sample Group GroupRegion in which respondent’s mother was born f (%)North America 94.0 92.6 95.4 ***Asia 0.7 0.9 0.5Latin America and the Caribbean 2.8 3.2 2.4Other e 2.6 3.4 1.8 **Sample size 2,139 1,073 1,066SOURCE: MDRC calculations using Baseline Information Form (BIF) data.NOTES: Rounding may cause slight discrepancies in sums and differences.A two-tailed t-test was applied to differences between research groups. Statistical significance levels areindicated as: *** = 1 percent; ** = 5 percent; * = 10 percent.Estimates are adjusted by cohort and college.TANF = Temporary Assistance for Needy Families.To analyze whether baseline characteristics jointly predicted research group status, a likelihood ratio test wasperformed, which yielded a p-value of 0.12. Convention suggests that this probability is large enough that thesepotential differences can be ignored in the analyses.Italics indicate nonexperimental data. Significance tests are not calculated for nonexperimental data.aRespondents who indicated that they are Hispanic and who chose a race are included only in theHispanic/Latino category.b“Other race” includes American Indians/Alaskan Natives and those who marked “other race/ethnicity” ormore than one racial category.cBenefits include Unemployment/Dislocated Worker benefits, Supplemental Security Income (SSI) ordisability, cash assistance or welfare, food stamps, and Section 8 or public housing.dDistributions may not add to 100 percent because categories are not mutually exclusive.eThis category includes the Baltics, the Commonwealth of Independent States, eastern and western Europe,North Africa, Sub-Saharan Africa, the Near East, and Oceania. The Commonwealth of Independent Statesincludes Armenia, Azerbaijan, Belarus, Georgia, Kazakhstan, Kyrgyzstan, Republic of Moldova, Russia,Tajikistan, Turkmenistan (until August 2005), Ukraine, and Uzbekistan. Countries are grouped by regionaccording to the U.S. Bureau of the Census, International Data Base.fThe majority of respondents reported that both parents were born in the same region as each other.which respondent was born” as an example, program group members and control group membersdiffered with respect to the percentage who were from North America and the percentagewho were from other regions. However, this difference represents only one real difference, a differencewith respect to the location of respondent’s birthplace. Similarly, the absence of differencesbetween program group members and control group members with respect to the percentagewho are males and the percentage who are females should only be thought of as oneindication of the success of random assignment at creating equivalent groups.In addition to the individual tests described above, an omnibus test was conducted to assesswhether overall systematic differences in baseline characteristics were observed betweenthe two research groups. In order to assess this possibility, a logistic regression model was used72