- Page 1:
OPENING DOORSMORE GUIDANCE,BETTER R
- Page 4 and 5:
Funders of the Opening Doors Projec
- Page 7 and 8:
ContentsOverviewList of Tables, Fig
- Page 9 and 10:
List of Tables, Figures, and BoxesT
- Page 11:
PrefaceIf approved by Congress, the
- Page 14 and 15:
guidance on the study. Thomas Brock
- Page 16 and 17:
• The Ohio colleges successfully
- Page 18 and 19:
Program group members were assigned
- Page 20 and 21:
• For the most part, the program
- Page 22 and 23:
offered, but might also provide stu
- Page 25 and 26:
Chapter 1IntroductionOver the last
- Page 27 and 28:
The Opening Doors DemonstrationTabl
- Page 29 and 30:
sure that students complete the req
- Page 31 and 32:
While the mechanism through which s
- Page 33 and 34:
imately 1,700 to 1 in 2001. 22 Exac
- Page 35:
of literature exist on career couns
- Page 38 and 39:
The CollegeLorain County Community
- Page 40 and 41:
• Were beginning freshmen or cont
- Page 42 and 43:
The Opening Doors DemonstrationTabl
- Page 44 and 45:
Table 2.1 (continued)SOURCE: MDRC c
- Page 46 and 47:
Lorain and Owens Financial Aid Data
- Page 49 and 50:
Chapter 3The Implementation of the
- Page 51 and 52:
Toward the end of each student’s
- Page 53 and 54:
meet with their counselor a minimum
- Page 55:
The Opening Doors DemonstrationTabl
- Page 59 and 60:
Appendix Table C.2 shows informatio
- Page 61:
Opening Doors counselors, and progr
- Page 64 and 65:
Program Control Difference Standard
- Page 67 and 68:
Chapter 4The Effects of Enhanced St
- Page 69 and 70:
Program SemestersTable 4.1 (page 47
- Page 71 and 72:
Program Control Difference Standard
- Page 73 and 74:
Program Control Difference Standard
- Page 75 and 76:
The Opening Doors DemonstrationTabl
- Page 77 and 78:
Transcript Outcomes by GenderAssess
- Page 79 and 80:
Program Control Difference Standard
- Page 81 and 82:
Program Control Difference Standard
- Page 83 and 84:
correspond with the program’s imp
- Page 85 and 86:
Chapter 5Summary and ConclusionsLor
- Page 87 and 88:
The Opening Doors DemonstrationFigu
- Page 89 and 90:
An alternative interpretation of th
- Page 91:
Appendix ASupplementary Baseline In
- Page 94 and 95:
Full Program ControlCharacteristic
- Page 96 and 97:
Appendix Table A.1 (continued)Full
- Page 98 and 99:
Full Program ControlCharacteristic
- Page 100 and 101: Appendix Table A.2 (continued)Full
- Page 102 and 103: Appendix Table A.3 (continued)Full
- Page 105: Appendix BSurvey Response Analysis
- Page 108 and 109: Background Characteristics of Surve
- Page 110 and 111: Table B.1 (continued)Characteristic
- Page 112 and 113: The Opening Doors DemonstrationAppe
- Page 114 and 115: Table B.2 (continued)SOURCE: MDRC c
- Page 116 and 117: Table B.3 (continued)Characteristic
- Page 118 and 119: The Opening Doors DemonstrationAppe
- Page 120 and 121: Table B.4 (continued)SOURCE: MDRC c
- Page 122 and 123: Table B.5 (continued)Characteristic
- Page 124 and 125: The Opening Doors DemonstrationAppe
- Page 126 and 127: Table B.6 (continued)SOURCE: MDRC c
- Page 129 and 130: Lorain OwensProgram ProgramOutcome
- Page 131 and 132: Lorain County Community CollegeOwen
- Page 133: Appendix DDescription of Scales Pre
- Page 136 and 137: 4. I hardly ever expect things to g
- Page 138 and 139: Social Support and Civic Engagement
- Page 140 and 141: Psychological Distress (6-item summ
- Page 143 and 144: Lorain County Community CollegeOwen
- Page 145 and 146: Lorain County Community CollegeOwen
- Page 147 and 148: Lorain County Community CollegeOwen
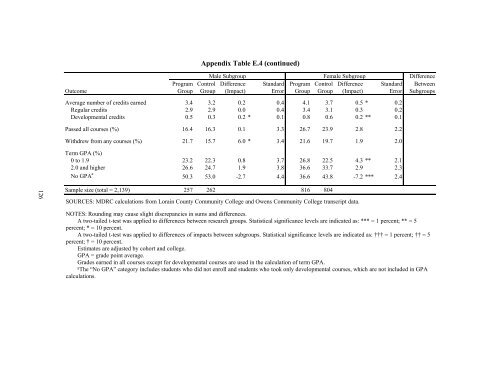
- Page 149: Male SubgroupFemale SubgroupDiffere
- Page 153 and 154: Male SubgroupFemale SubgroupDiffere
- Page 155 and 156: Lorain County Community CollegeOwen
- Page 157 and 158: Appendix Table E.7 (continued)SOURC
- Page 159 and 160: Lorain County Community CollegeOwen
- Page 161 and 162: The Opening Doors DemonstrationAppe
- Page 163 and 164: Appendix Table E.10 (continued)SOUR
- Page 165 and 166: ReferencesAdelman, Clifford. 2004.
- Page 167 and 168: EARLIER MDRC PUBLICATIONS ON OPENIN
- Page 169: About MDRCMDRC is a nonprofit, nonp