MORE GUIDANCE, BETTER RESULTS?
MORE GUIDANCE, BETTER RESULTS?
MORE GUIDANCE, BETTER RESULTS?

You also want an ePaper? Increase the reach of your titles
YUMPU automatically turns print PDFs into web optimized ePapers that Google loves.
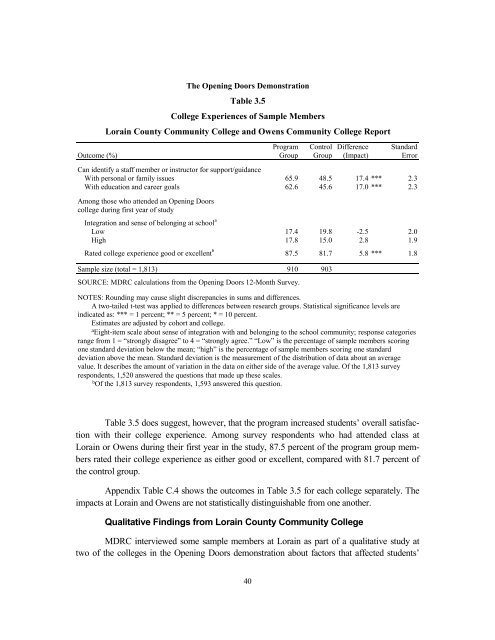
Program Control Difference StandardOutcome (%) Group Group (Impact) ErrorCan identify a staff member or instructor for support/guidanceWith personal or family issues 65.9 48.5 17.4 *** 2.3With education and career goals 62.6 45.6 17.0 *** 2.3Among those who attended an Opening Doorscollege during first year of studyThe Opening Doors DemonstrationTable 3.5College Experiences of Sample MembersLorain County Community College and Owens Community College ReportIntegration and sense of belonging at school aLow 17.4 19.8 -2.5 2.0High 17.8 15.0 2.8 1.9Rated college experience good or excellent b 87.5 81.7 5.8 *** 1.8Sample size (total = 1,813) 910 903SOURCE: MDRC calculations from the Opening Doors 12-Month Survey.NOTES: Rounding may cause slight discrepancies in sums and differences.A two-tailed t-test was applied to differences between research groups. Statistical significance levels areindicated as: *** = 1 percent; ** = 5 percent; * = 10 percent.Estimates are adjusted by cohort and college.a Eight-item scale about sense of integration with and belonging to the school community; response categoriesrange from 1 = “strongly disagree” to 4 = “strongly agree.” “Low” is the percentage of sample members scoringone standard deviation below the mean; “high” is the percentage of sample members scoring one standarddeviation above the mean. Standard deviation is the measurement of the distribution of data about an averagevalue. It describes the amount of variation in the data on either side of the average value. Of the 1,813 surveyrespondents, 1,520 answered the questions that made up these scales.bOf the 1,813 survey respondents, 1,593 answered this question.Table 3.5 does suggest, however, that the program increased students’ overall satisfactionwith their college experience. Among survey respondents who had attended class atLorain or Owens during their first year in the study, 87.5 percent of the program group membersrated their college experience as either good or excellent, compared with 81.7 percent ofthe control group.Appendix Table C.4 shows the outcomes in Table 3.5 for each college separately. Theimpacts at Lorain and Owens are not statistically distinguishable from one another.Qualitative Findings from Lorain County Community CollegeMDRC interviewed some sample members at Lorain as part of a qualitative study attwo of the colleges in the Opening Doors demonstration about factors that affected students’40