MORE GUIDANCE, BETTER RESULTS?
MORE GUIDANCE, BETTER RESULTS?
MORE GUIDANCE, BETTER RESULTS?
You also want an ePaper? Increase the reach of your titles
YUMPU automatically turns print PDFs into web optimized ePapers that Google loves.
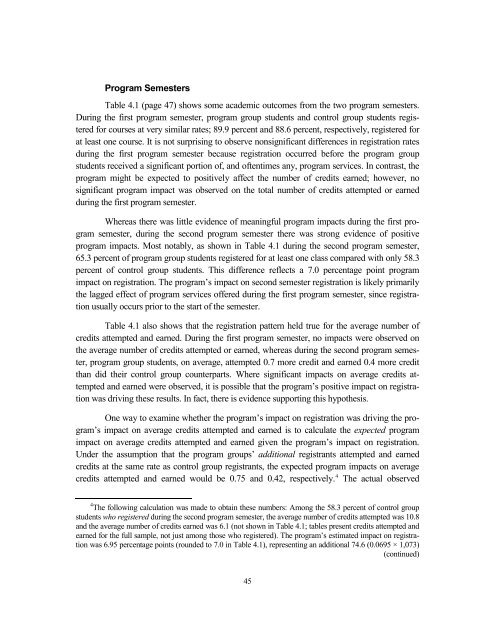
Program SemestersTable 4.1 (page 47) shows some academic outcomes from the two program semesters.During the first program semester, program group students and control group students registeredfor courses at very similar rates; 89.9 percent and 88.6 percent, respectively, registered forat least one course. It is not surprising to observe nonsignificant differences in registration ratesduring the first program semester because registration occurred before the program groupstudents received a significant portion of, and oftentimes any, program services. In contrast, theprogram might be expected to positively affect the number of credits earned; however, nosignificant program impact was observed on the total number of credits attempted or earnedduring the first program semester.Whereas there was little evidence of meaningful program impacts during the first programsemester, during the second program semester there was strong evidence of positiveprogram impacts. Most notably, as shown in Table 4.1 during the second program semester,65.3 percent of program group students registered for at least one class compared with only 58.3percent of control group students. This difference reflects a 7.0 percentage point programimpact on registration. The program’s impact on second semester registration is likely primarilythe lagged effect of program services offered during the first program semester, since registrationusually occurs prior to the start of the semester.Table 4.1 also shows that the registration pattern held true for the average number ofcredits attempted and earned. During the first program semester, no impacts were observed onthe average number of credits attempted or earned, whereas during the second program semester,program group students, on average, attempted 0.7 more credit and earned 0.4 more creditthan did their control group counterparts. Where significant impacts on average credits attemptedand earned were observed, it is possible that the program’s positive impact on registrationwas driving these results. In fact, there is evidence supporting this hypothesis.One way to examine whether the program’s impact on registration was driving the program’simpact on average credits attempted and earned is to calculate the expected programimpact on average credits attempted and earned given the program’s impact on registration.Under the assumption that the program groups’ additional registrants attempted and earnedcredits at the same rate as control group registrants, the expected program impacts on averagecredits attempted and earned would be 0.75 and 0.42, respectively. 4 The actual observed4 The following calculation was made to obtain these numbers: Among the 58.3 percent of control groupstudents who registered during the second program semester, the average number of credits attempted was 10.8and the average number of credits earned was 6.1 (not shown in Table 4.1; tables present credits attempted andearned for the full sample, not just among those who registered). The program’s estimated impact on registrationwas 6.95 percentage points (rounded to 7.0 in Table 4.1), representing an additional 74.6 (0.0695 × 1,073)(continued)45


