MORE GUIDANCE, BETTER RESULTS?
MORE GUIDANCE, BETTER RESULTS?
MORE GUIDANCE, BETTER RESULTS?

Create successful ePaper yourself
Turn your PDF publications into a flip-book with our unique Google optimized e-Paper software.
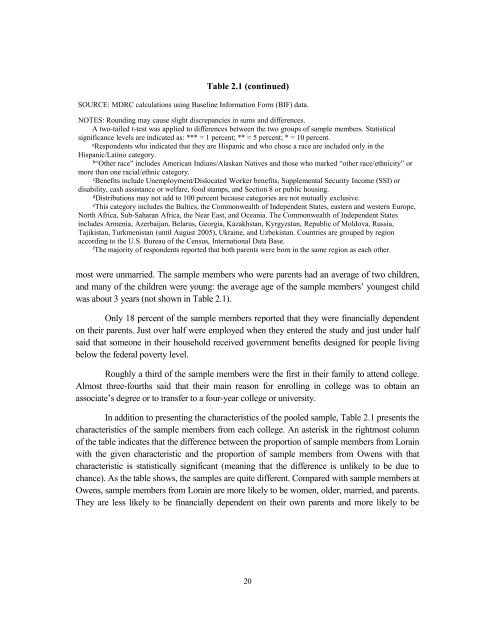
Table 2.1 (continued)SOURCE: MDRC calculations using Baseline Information Form (BIF) data.NOTES: Rounding may cause slight discrepancies in sums and differences.A two-tailed t-test was applied to differences between the two groups of sample members. Statisticalsignificance levels are indicated as: *** = 1 percent; ** = 5 percent; * = 10 percent.aRespondents who indicated that they are Hispanic and who chose a race are included only in theHispanic/Latino category.b“Other race” includes American Indians/Alaskan Natives and those who marked “other race/ethnicity” ormore than one racial/ethnic category.cBenefits include Unemployment/Dislocated Worker benefits, Supplemental Security Income (SSI) ordisability, cash assistance or welfare, food stamps, and Section 8 or public housing.dDistributions may not add to 100 percent because categories are not mutually exclusive.eThis category includes the Baltics, the Commonwealth of Independent States, eastern and western Europe,North Africa, Sub-Saharan Africa, the Near East, and Oceania. The Commonwealth of Independent Statesincludes Armenia, Azerbaijan, Belarus, Georgia, Kazakhstan, Kyrgyzstan, Republic of Moldova, Russia,Tajikistan, Turkmenistan (until August 2005), Ukraine, and Uzbekistan. Countries are grouped by regionaccording to the U.S. Bureau of the Census, International Data Base.fThe majority of respondents reported that both parents were born in the same region as each other.most were unmarried. The sample members who were parents had an average of two children,and many of the children were young: the average age of the sample members’ youngest childwas about 3 years (not shown in Table 2.1).Only 18 percent of the sample members reported that they were financially dependenton their parents. Just over half were employed when they entered the study and just under halfsaid that someone in their household received government benefits designed for people livingbelow the federal poverty level.Roughly a third of the sample members were the first in their family to attend college.Almost three-fourths said that their main reason for enrolling in college was to obtain anassociate’s degree or to transfer to a four-year college or university.In addition to presenting the characteristics of the pooled sample, Table 2.1 presents thecharacteristics of the sample members from each college. An asterisk in the rightmost columnof the table indicates that the difference between the proportion of sample members from Lorainwith the given characteristic and the proportion of sample members from Owens with thatcharacteristic is statistically significant (meaning that the difference is unlikely to be due tochance). As the table shows, the samples are quite different. Compared with sample members atOwens, sample members from Lorain are more likely to be women, older, married, and parents.They are less likely to be financially dependent on their own parents and more likely to be20