- Page 2: This page intentionally left blank
- Page 5 and 6: ReferencesTABLE OF CONTENTS7.2.4 HM
- Page 7 and 8: List of Tables, Figures, and Append
- Page 9 and 10: List of Tables, Figures, and Append
- Page 11 and 12: Acronyms and Abbreviations°F degre
- Page 13 and 14: Acronyms and AbbreviationsNCTSNFIPN
- Page 15 and 16: AcknowledgementsRay Calvo, Guam Env
- Page 17 and 18: 1. Section 1 ONE PrerequisitesSECTI
- Page 19 and 20: 2. Section 2 TW O Backgrou ndSECTIO
- Page 21 and 22: SECTIONTWOBackgroundanalyses should
- Page 23 and 24: 3. Section 3 THR EE Planning Pro ce
- Page 25 and 26: SECTIONTHREEPlanning Process Docume
- Page 27 and 28: SECTIONTHREEPlanning Process Docume
- Page 29 and 30: SECTIONTHREEPlanning Process Docume
- Page 31 and 32: SECTIONTHREEPlanning Process Docume
- Page 33 and 34: 4. Section 4 F OUR Island D escript
- Page 35 and 36: SECTIONFOURIsland DescriptionThe El
- Page 37 and 38: SECTIONFOURIsland DescriptionTable
- Page 39 and 40: SECTIONFOURIsland DescriptionTable
- Page 41 and 42: SECTIONFOURIsland DescriptionVillag
- Page 43: SECTIONFOURIsland DescriptionDespit
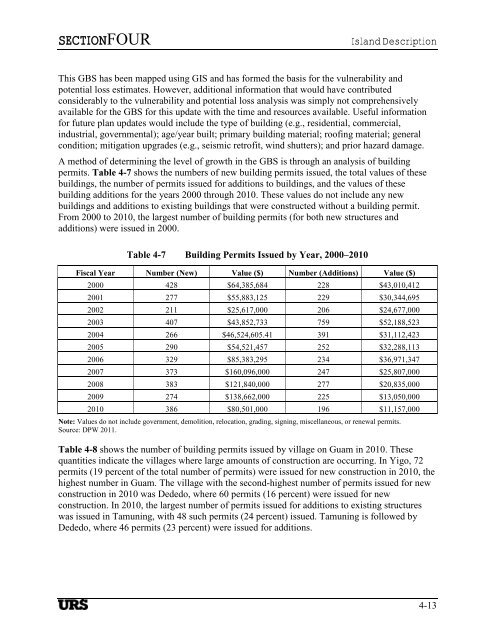
- Page 47 and 48: SECTIONFOURIsland DescriptionOne of
- Page 49 and 50: 5. Section 5 F IVE Risk AssessmentS
- Page 51 and 52: SECTIONFIVERisk AssessmentTable 5-2
- Page 53 and 54: SECTIONFIVERisk Assessment• Terro
- Page 55 and 56: SECTIONFIVERisk Assessmenthigh surf
- Page 57 and 58: SECTIONFIVERisk Assessmentagainst i
- Page 59 and 60: SECTIONFIVERisk Assessmenthowever,
- Page 61 and 62: SECTIONFIVERisk AssessmentTable 5-4
- Page 63 and 64: SECTIONFIVERisk Assessment5.3.3 Dro
- Page 65 and 66: SECTIONFIVERisk Assessmentsoil, typ
- Page 67 and 68: SECTIONFIVERisk Assessmentlateral s
- Page 69 and 70: SECTIONFIVERisk Assessmentscarps of
- Page 71 and 72: SECTIONFIVERisk Assessmentlead to i
- Page 73 and 74: SECTIONFIVERisk AssessmentFlash Flo
- Page 75 and 76: SECTIONFIVERisk AssessmentThe one r
- Page 77 and 78: SECTIONFIVERisk Assessment5.3.6 Haz
- Page 79 and 80: SECTIONFIVERisk AssessmentType of I
- Page 81 and 82: SECTIONFIVERisk AssessmentHigh surf
- Page 83 and 84: SECTIONFIVERisk AssessmentCloud-to-
- Page 85 and 86: SECTIONFIVERisk Assessment5.3.10 Sa
- Page 87 and 88: SECTIONFIVERisk AssessmentPhilippin
- Page 89 and 90: SECTIONFIVERisk AssessmentNatureLan
- Page 91 and 92: SECTIONFIVERisk Assessmentto areas
- Page 93 and 94: SECTIONFIVERisk Assessmentcan cause
- Page 95 and 96:
SECTIONFIVERisk Assessmenthistorica
- Page 97 and 98:
SECTIONFIVERisk AssessmentModel was
- Page 99 and 100:
SECTIONFIVERisk AssessmentHistorica
- Page 101 and 102:
SECTIONFIVERisk Assessmentspecies t
- Page 103 and 104:
SECTIONFIVERisk AssessmentDMA 2000
- Page 105 and 106:
SECTIONFIVERisk Assessmentassets id
- Page 107 and 108:
SECTIONFIVERisk Assessmentanalysis
- Page 109 and 110:
SECTIONFIVERisk AssessmentTable 5-2
- Page 111 and 112:
SECTIONFIVERisk AssessmentEarthquak
- Page 113 and 114:
SECTIONFIVERisk AssessmentRepetitiv
- Page 115 and 116:
SECTIONFIVERisk Assessmentequal to
- Page 117 and 118:
SECTIONFIVERisk AssessmentAdditiona
- Page 119 and 120:
6. Section 6 SIX Mitigation Strateg
- Page 121 and 122:
SECTIONSIXMitigation StrategyCapabi
- Page 123 and 124:
SECTIONSIXMitigation StrategyCapabi
- Page 125 and 126:
SECTIONSIXMitigation StrategyCapabi
- Page 127 and 128:
SECTIONSIXMitigation StrategyDepart
- Page 129 and 130:
SECTIONSIXMitigation Strategyand ov
- Page 131 and 132:
SECTIONSIXMitigation Strategycost r
- Page 133 and 134:
SECTIONSIXMitigation Strategy• Di
- Page 135 and 136:
SECTIONSIXMitigation StrategyCommer
- Page 137 and 138:
SECTIONSIXMitigation Strategy6.5 MI
- Page 139 and 140:
SECTIONSIXMitigation StrategyTable
- Page 141 and 142:
SECTIONSIXMitigation StrategyTable
- Page 143 and 144:
SECTIONSIXMitigation StrategyTable
- Page 145 and 146:
7. Section 7 SEVEN Plan Mainten an
- Page 147 and 148:
SECTIONSEVENPlan Maintenance Proces
- Page 149 and 150:
SECTIONEIGHTReferences8. Section 8
- Page 151 and 152:
SECTIONEIGHTReferencesGovernment of
- Page 153 and 154:
SECTIONEIGHTReferencesGuam Departme
- Page 155 and 156:
SECTIONEIGHTReferencesLautner, Beth
- Page 157 and 158:
SECTIONEIGHTReferencesPacific ENSO
- Page 159 and 160:
SECTIONEIGHTReferencesUSGS. 2004.
- Page 161 and 162:
Appendix AAdoption Resolution
- Page 165 and 166:
Appendix BFEMA Crosswalk
- Page 167 and 168:
STANDARD STATE HAZARD MITIGATION PL
- Page 169 and 170:
STANDARD STATE HAZARD MITIGATION PL
- Page 171 and 172:
STANDARD STATE HAZARD MITIGATION PL
- Page 173 and 174:
STANDARD STATE HAZARD MITIGATION PL
- Page 175 and 176:
STANDARD STATE HAZARD MITIGATION PL
- Page 177 and 178:
STANDARD STATE HAZARD MITIGATION PL
- Page 179 and 180:
STANDARD STATE HAZARD MITIGATION PL
- Page 181 and 182:
STANDARD STATE HAZARD MITIGATION PL
- Page 183 and 184:
STANDARD STATE HAZARD MITIGATION PL
- Page 185 and 186:
Appendix CDefinitions
- Page 187 and 188:
Appendix CDefinitions100-hundred ye
- Page 189 and 190:
Appendix CDefinitionsConstruction o
- Page 191 and 192:
Appendix CDefinitionsconcept of dis
- Page 193 and 194:
Appendix CDefinitionsthat significa
- Page 195 and 196:
Appendix CDefinitionsInfestations m
- Page 197 and 198:
Appendix CDefinitionsPrivate activi
- Page 199 and 200:
Appendix CDefinitionsSpecial events
- Page 201 and 202:
Appendix CDefinitionsflooding, all
- Page 203 and 204:
Appendix DFigures
- Page 205 and 206:
Appendix EEssential Facilities, Maj
- Page 207 and 208:
Appendix EEssential Facilities, Maj
- Page 209 and 210:
Appendix EEssential Facilities, Maj
- Page 211 and 212:
Appendix EEssential Facilities, Maj
- Page 213 and 214:
Appendix EEssential Facilities, Maj
- Page 215 and 216:
Appendix EEssential Facilities, Maj
- Page 217 and 218:
Appendix EEssential Facilities, Maj
- Page 219 and 220:
Appendix EEssential Facilities, Maj
- Page 221 and 222:
Appendix EEssential Facilities, Maj
- Page 223 and 224:
Appendix EEssential Facilities, Maj
- Page 225 and 226:
Appendix EEssential Facilities, Maj
- Page 227 and 228:
Appendix EEssential Facilities, Maj
- Page 229 and 230:
Appendix EEssential Facilities, Maj
- Page 231 and 232:
Appendix EEssential Facilities, Maj
- Page 233 and 234:
Appendix EEssential Facilities, Maj
- Page 235 and 236:
Appendix EEssential Facilities, Maj
- Page 237 and 238:
Appendix EEssential Facilities, Maj
- Page 239 and 240:
Appendix EEssential Facilities, Maj
- Page 241 and 242:
Appendix EEssential Facilities, Maj
- Page 243 and 244:
Appendix EEssential Facilities, Maj
- Page 245 and 246:
Appendix FVulnerability and Potenti
- Page 247 and 248:
Appendix FVulnerability and Potenti
- Page 249 and 250:
Appendix FVulnerability and Potenti
- Page 251 and 252:
Appendix FVulnerability and Potenti
- Page 253 and 254:
Appendix FVulnerability and Potenti
- Page 255 and 256:
Appendix FVulnerability and Potenti
- Page 257 and 258:
Appendix FVulnerability and Potenti
- Page 259 and 260:
Appendix FVulnerability and Potenti
- Page 261 and 262:
Appendix FVulnerability and Potenti
- Page 263 and 264:
Appendix FVulnerability and Potenti
- Page 265 and 266:
Appendix FVulnerability and Potenti
- Page 267 and 268:
Appendix FVulnerability and Potenti
- Page 269 and 270:
Appendix FVulnerability and Potenti
- Page 271 and 272:
Appendix FVulnerability and Potenti
- Page 273 and 274:
Appendix FVulnerability and Potenti
- Page 275 and 276:
Appendix FVulnerability and Potenti
- Page 277 and 278:
Appendix GPlan Maintenance Document
- Page 279 and 280:
Appendix GPlan Maintenance Document
- Page 281 and 282:
Appendix GPlan Maintenance Document
- Page 283 and 284:
GOVERNMENT OF GUAM CERIFICATION:App


