Molina Medicaid Solutions - DHHR
Molina Medicaid Solutions - DHHR
Molina Medicaid Solutions - DHHR
You also want an ePaper? Increase the reach of your titles
YUMPU automatically turns print PDFs into web optimized ePapers that Google loves.
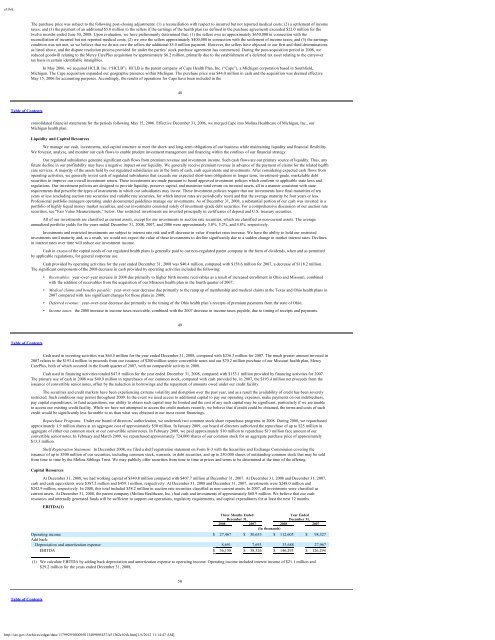
e10vkThe purchase price was subject to the following post-closing adjustments: (1) a reconciliation with respect to incurred but not reported medical costs; (2) a settlement of incometaxes; and (3) the payment of an additional $5.0 million to the sellers if the earnings of the health plan (as defined in the purchase agreement) exceeded $22.0 million for thetwelve months ended June 30, 2008. Upon evaluation, we have preliminarily determined that: (1) the sellers owe us approximately $650,000 in connection with thereconciliation of incurred but not reported medical costs; (2) we owe the sellers approximately $400,000 in connection with the settlement of income taxes; and (3) the earningscondition was not met, so we believe that we do not owe the sellers the additional $5.0 million payment. However, the sellers have objected to our first and third determinationsas listed above, and the dispute resolution process provided for under the parties’ stock purchase agreement has commenced. During the post-acquisition period in 2008, wereduced goodwill relating to the Mercy CarePlus acquisition by approximately $6.2 million, primarily due to the establishment of a deferred tax asset relating to the carryovertax basis in certain identifiable intangibles.In May 2006, we acquired HCLB, Inc. (“HCLB”). HCLB is the parent company of Cape Health Plan, Inc. (“Cape”), a Michigan corporation based in Southfield,Michigan. The Cape acquisition expanded our geographic presence within Michigan. The purchase price was $44.0 million in cash and the acquisition was deemed effectiveMay 15, 2006 for accounting purposes. Accordingly, the results of operations for Cape have been included in the48Table of Contentsconsolidated financial statements for the periods following May 15, 2006. Effective December 31, 2006, we merged Cape into <strong>Molina</strong> Healthcare of Michigan, Inc., ourMichigan health plan.Liquidity and Capital ResourcesWe manage our cash, investments, and capital structure to meet the short- and long-term obligations of our business while maintaining liquidity and financial flexibility.We forecast, analyze, and monitor our cash flows to enable prudent investment management and financing within the confines of our financial strategy.Our regulated subsidiaries generate significant cash flows from premium revenue and investment income. Such cash flows are our primary source of liquidity. Thus, anyfuture decline in our profitability may have a negative impact on our liquidity. We generally receive premium revenue in advance of the payment of claims for the related healthcare services. A majority of the assets held by our regulated subsidiaries are in the form of cash, cash equivalents and investments. After considering expected cash flows fromoperating activities, we generally invest cash of regulated subsidiaries that exceeds our expected short-term obligations in longer term, investment-grade, marketable debtsecurities to improve our overall investment return. These investments are made pursuant to board approved investment policies which conform to applicable state laws andregulations. Our investment policies are designed to provide liquidity, preserve capital, and maximize total return on invested assets, all in a manner consistent with staterequirements that prescribe the types of instruments in which our subsidiaries may invest. These investment policies require that our investments have final maturities of tenyears or less (excluding auction rate securities and variable rate securities, for which interest rates are periodically reset) and that the average maturity be four years or less.Professional portfolio managers operating under documented guidelines manage our investments. As of December 31, 2008, a substantial portion of our cash was invested in aportfolio of highly liquid money market securities, and our investments consisted solely of investment-grade debt securities. For a comprehensive discussion of our auction ratesecurities, see “Fair Value Measurements,” below. Our restricted investments are invested principally in certificates of deposit and U.S. treasury securities.All of our investments are classified as current assets, except for our investments in auction rate securities, which are classified as non-current assets. The averageannualized portfolio yields for the years ended December 31, 2008, 2007, and 2006 were approximately 3.0%, 5.2%, and 4.8%, respectively.Investments and restricted investments are subject to interest rate risk and will decrease in value if market rates increase. We have the ability to hold our restrictedinvestments until maturity and, as a result, we would not expect the value of these investments to decline significantly due to a sudden change in market interest rates. Declinesin interest rates over time will reduce our investment income.Cash in excess of the capital needs of our regulated health plans is generally paid to our non-regulated parent company in the form of dividends, when and as permittedby applicable regulations, for general corporate use.Cash provided by operating activities for the year ended December 31, 2008 was $40.4 million, compared with $158.6 million for 2007, a decrease of $118.2 million.The significant components of the 2008 decrease in cash provided by operating activities included the following:• Receivables: year-over-year increase in 2008 due primarily to higher birth income receivables as a result of increased enrollment in Ohio and Missouri, combinedwith the addition of receivables from the acquisition of our Missouri health plan in the fourth quarter of 2007;• Medical claims and benefits payable: year-over-year decrease due primarily to the ramp up of membership and medical claims at the Texas and Ohio health plans in2007 compared with less significant changes for those plans in 2008;• Deferred revenue: year-over-year decrease due primarily to the timing of the Ohio health plan’s receipts of premium payments from the state of Ohio;• Income taxes: the 2008 increase in income taxes receivable, combined with the 2007 decrease in income taxes payable, due to timing of receipts and payments.49Table of ContentsCash used in investing activities was $64.5 million for the year ended December 31, 2008, compared with $256.3 million for 2007. The much greater amount invested in2007 relates to the $193.4 million in proceeds from our issuance of $200 million senior convertible notes and our $70.2 million purchase of our Missouri health plan, MercyCarePlus, both of which occurred in the fourth quarter of 2007, with no comparable activity in 2008.Cash used in financing activities totaled $47.8 million for the year ended December 31, 2008, compared with $153.1 million provided by financing activities for 2007.The primary use of cash in 2008 was $49.9 million in repurchases of our common stock, compared with cash provided by, in 2007, the $193.4 million net proceeds from theissuance of convertible senior notes, offset by the reduction in borrowings and the repayment of amounts owed under our credit facility.The securities and credit markets have been experiencing extreme volatility and disruption over the past year, and as a result the availability of credit has been severelyrestricted. Such conditions may persist throughout 2009. In the event we need access to additional capital to pay our operating expenses, make payments on our indebtedness,pay capital expenditures, or fund acquisitions, our ability to obtain such capital may be limited and the cost of any such capital may be significant, particularly if we are unableto access our existing credit facility. While we have not attempted to access the credit markets recently, we believe that if credit could be obtained, the terms and costs of suchcredit would be significantly less favorable to us than what was obtained in our most recent financings.Repurchase Programs. Under our board of directors’ authorization, we undertook two common stock share repurchase programs in 2008. During 2008, we repurchasedapproximately 1.9 million shares at an aggregate cost of approximately $50 million. In January 2009, our board of directors authorized the repurchase of up to $25 million inaggregate of either our common stock or our convertible senior notes. In February 2009, we paid approximately $10 million to repurchase $13 million face amount of ourconvertible senior notes. In February and March 2009, we repurchased approximately 724,000 shares of our common stock for an aggregate purchase price of approximately$13.3 million.Shelf Registration Statement. In December 2008, we filed a shelf registration statement on Form S-3 with the Securities and Exchange Commission covering theissuance of up to $300 million of our securities, including common stock, warrants, or debt securities, and up to 250,000 shares of outstanding common stock that may be soldfrom time to time by the <strong>Molina</strong> Siblings Trust. We may publicly offer securities from time to time at prices and terms to be determined at the time of the offering.Capital ResourcesAt December 31, 2008, we had working capital of $340.8 million compared with $407.7 million at December 31, 2007. At December 31, 2008 and December 31, 2007,cash and cash equivalents were $387.2 million and $459.1 million, respectively. At December 31, 2008 and December 31, 2007, investments were $248.0 million and$242.9 million, respectively. In 2008, this total included $58.2 million in auction rate securities classified as non-current assets. In 2007, all investments were classified ascurrent assets. At December 31, 2008, the parent company (<strong>Molina</strong> Healthcare, Inc.) had cash and investments of approximately $68.9 million. We believe that our cashresources and internally generated funds will be sufficient to support our operations, regulatory requirements, and capital expenditures for at least the next 12 months.EBITDA(1)Three Months Ended Year EndedDecember 31, December 31,2008 2007 2008 2007(In thousands)Operating income $ 27,467 $ 30,633 $ 112,605 $ 98,327Add back:Depreciation and amortization expense 8,691 7,693 33,688 27,967EBITDA $ 36,158 $ 38,326 $ 146,293 $ 126,294(1) We calculate EBITDA by adding back depreciation and amortization expense to operating income. Operating income included interest income of $21.1 million and$29.2 million for the years ended December 31, 2008,50Table of Contentshttp://sec.gov/Archives/edgar/data/1179929/000095013409005437/a51362e10vk.htm[1/6/2012 11:14:47 AM]


