Molina Medicaid Solutions - DHHR
Molina Medicaid Solutions - DHHR
Molina Medicaid Solutions - DHHR

You also want an ePaper? Increase the reach of your titles
YUMPU automatically turns print PDFs into web optimized ePapers that Google loves.
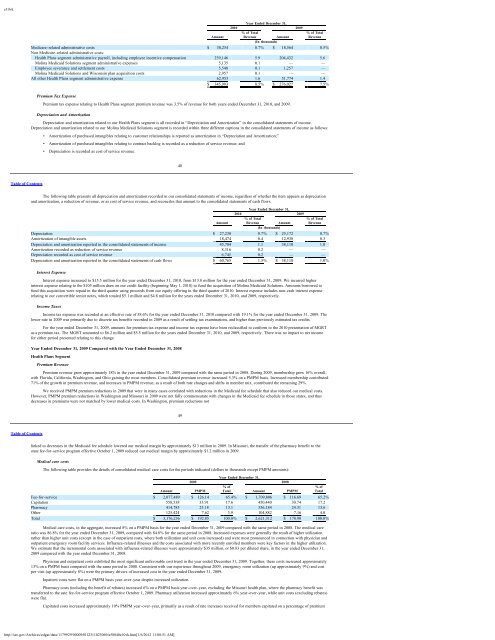
e10vkYear Ended December 31,2010 2009% of Total % of TotalAmount Revenue Amount Revenue(In thousands)Medicare-related administrative costs $ 30,254 0.7% $ 18,564 0.5%Non Medicare-related administrative costs:Health Plans segment administrative payroll, including employee incentive compensation 239,146 5.9 204,432 5.6<strong>Molina</strong> <strong>Medicaid</strong> <strong>Solutions</strong> segment administrative expenses 5,135 0.1 — —Employee severance and settlement costs 5,548 0.1 1,257 —<strong>Molina</strong> <strong>Medicaid</strong> <strong>Solutions</strong> and Wisconsin plan acquisition costs 2,957 0.1 — —All other Health Plans segment administrative expense 62,953 1.6 51,774 1.4$ 345,993 8.5% $ 276,027 7.5%Premium Tax ExpensePremium tax expense relating to Health Plans segment premium revenue was 3.5% of revenue for both years ended December 31, 2010, and 2009.Depreciation and AmortizationDepreciation and amortization related to our Health Plans segment is all recorded in “Depreciation and Amortization” in the consolidated statements of income.Depreciation and amortization related to our <strong>Molina</strong> <strong>Medicaid</strong> <strong>Solutions</strong> segment is recorded within three different captions in the consolidated statements of income as follows:• Amortization of purchased intangibles relating to customer relationships is reported as amortization in “Depreciation and Amortization;”• Amortization of purchased intangibles relating to contract backlog is recorded as a reduction of service revenue; and• Depreciation is recorded as cost of service revenue.48Table of ContentsThe following table presents all depreciation and amortization recorded in our consolidated statements of income, regardless of whether the item appears as depreciationand amortization, a reduction of revenue, or as cost of service revenue, and reconciles that amount to the consolidated statements of cash flows.Year Ended December 31,2010 2009% of Total % of TotalAmount Revenue Amount Revenue(In thousands)Depreciation $ 27,230 0.7% $ 25,172 0.7%Amortization of intangible assets 18,474 0.4 12,938 0.3Depreciation and amortization reported in the consolidated statements of income 45,704 1.1 38,110 1.0Amortization recorded as reduction of service revenue 8,316 0.2 — —Depreciation recorded as cost of service revenue 6,745 0.2 — —Depreciation and amortization reported in the consolidated statements of cash flows $ 60,765 1.5% $ 38,110 1.0%Interest ExpenseInterest expense increased to $15.5 million for the year ended December 31, 2010, from $13.8 million for the year ended December 31, 2009. We incurred higherinterest expense relating to the $105 million draw on our credit facility (beginning May 1, 2010) to fund the acquisition of <strong>Molina</strong> <strong>Medicaid</strong> <strong>Solutions</strong>. Amounts borrowed tofund this acquisition were repaid in the third quarter using proceeds from our equity offering in the third quarter of 2010. Interest expense includes non-cash interest expenserelating to our convertible senior notes, which totaled $5.1 million and $4.8 million for the years ended December 31, 2010, and 2009, respectively.Income TaxesIncome tax expense was recorded at an effective rate of 38.6% for the year ended December 31, 2010 compared with 19.1% for the year ended December 31, 2009. Thelower rate in 2009 was primarily due to discrete tax benefits recorded in 2009 as a result of settling tax examinations, and higher than previously estimated tax credits.For the year ended December 31, 2009, amounts for premium tax expense and income tax expense have been reclassified to conform to the 2010 presentation of MGRTas a premium tax. The MGRT amounted to $6.2 million and $5.5 million for the years ended December 31, 2010, and 2009, respectively. There was no impact to net incomefor either period presented relating to this change.Year Ended December 31, 2009 Compared with the Year Ended December 31, 2008Health Plans SegmentPremium RevenuePremium revenue grew approximately 18% in the year ended December 31, 2009 compared with the same period in 2008. During 2009, membership grew 16% overall,with Florida, California, Washington, and Ohio gaining the most members. Consolidated premium revenue increased 5.3% on a PMPM basis. Increased membership contributed71% of the growth in premium revenue, and increases in PMPM revenue, as a result of both rate changes and shifts in member mix, contributed the remaining 29%.We received PMPM premium reductions in 2009 that were in many cases correlated with reductions in the <strong>Medicaid</strong> fee schedule that also reduced our medical costs.However, PMPM premium reductions in Washington and Missouri in 2009 were not fully commensurate with changes in the <strong>Medicaid</strong> fee schedule in those states, and thusdecreases in premiums were not matched by lower medical costs. In Washington, premium reductions not49Table of Contentslinked to decreases in the <strong>Medicaid</strong> fee schedule lowered our medical margin by approximately $13 million in 2009. In Missouri, the transfer of the pharmacy benefit to thestate fee-for-service program effective October 1, 2009 reduced our medical margin by approximately $1.2 million in 2009.Medical care costsThe following table provides the details of consolidated medical care costs for the periods indicated (dollars in thousands except PMPM amounts):Year Ended December 31,2009 2008% of % ofAmount PMPM Total Amount PMPM TotalFee-for-service $ 2,077,489 $ 126.14 65.4% $ 1,709,806 $ 116.69 65.2%Capitation 558,538 33.91 17.6 450,440 30.74 17.2Pharmacy 414,785 25.18 13.1 356,184 24.31 13.6Other 125,424 7.62 3.9 104,882 7.16 4.0Total $ 3,176,236 $ 192.85 100.0% $ 2,621,312 $ 178.90 100.0%Medical care costs, in the aggregate, increased 8% on a PMPM basis for the year ended December 31, 2009 compared with the same period in 2008. The medical careratio was 86.8% for the year ended December 31, 2009, compared with 84.8% for the same period in 2008. Increased expenses were generally the result of higher utilizationrather than higher unit costs (except in the case of outpatient costs, where both utilization and unit costs increased) and were most pronounced in connection with physician andoutpatient emergency room facility services. Influenza-related illnesses and the costs associated with more recently enrolled members were key factors in the higher utilization.We estimate that the incremental costs associated with influenza-related illnesses were approximately $35 million, or $0.83 per diluted share, in the year ended December 31,2009 compared with the year ended December 31, 2008.Physician and outpatient costs exhibited the most significant unfavorable cost trend in the year ended December 31, 2009. Together, these costs increased approximately13% on a PMPM basis compared with the same period in 2008. Consistent with our experience throughout 2009, emergency room utilization (up approximately 9%) and costper visit (up approximately 8%) were the primary drivers of increased cost in the year ended December 31, 2009.Inpatient costs were flat on a PMPM basis year-over-year despite increased utilization.Pharmacy costs (including the benefit of rebates) increased 6% on a PMPM basis year-over-year, excluding the Missouri health plan, where the pharmacy benefit wastransferred to the sate fee-for-service program effective October 1, 2009. Pharmacy utilization increased approximately 6% year-over-year, while unit costs (excluding rebates)were flat.Capitated costs increased approximately 10% PMPM year-over-year, primarily as a result of rate increases received for members capitated on a percentage of premiumhttp://sec.gov/Archives/edgar/data/1179929/000095012311023069/a58840e10vk.htm[1/6/2012 11:08:51 AM]