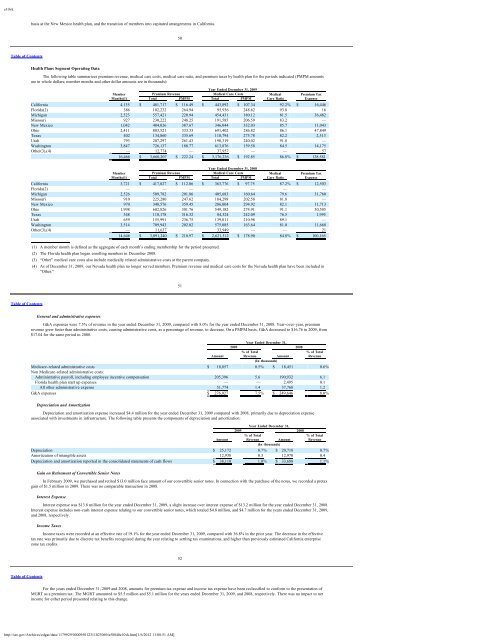
e10vkbasis at the New Mexico health plan, and the transition of members into capitated arrangements in California.50Table of ContentsHealth Plans Segment Operating DataThe following table summarizes premium revenue, medical care costs, medical care ratio, and premium taxes by health plan for the periods indicated (PMPM amountsare in whole dollars; member months and other dollar amounts are in thousands):Year Ended December 31, 2009Member Premium Revenue Medical Care Costs Medical Premium TaxMonths(1) Total PMPM Total PMPM Care Ratio ExpenseCalifornia 4,135 $ 481,717 $ 116.49 $ 443,892 $ 107.34 92.2% $ 16,446Florida(2) 386 102,232 264.94 95,936 248.62 93.8 16Michigan 2,523 557,421 220.94 454,431 180.12 81.5 36,482Missouri 927 230,222 248.25 191,585 206.59 83.2 —New Mexico 1,042 404,026 387.67 346,044 332.03 85.7 11,043Ohio 2,411 803,521 333.33 691,402 286.82 86.1 47,849Texas 402 134,860 335.69 110,794 275.78 82.2 2,513Utah 793 207,297 261.43 190,319 240.02 91.8 —Washington 3,847 726,137 188.77 613,876 159.58 84.5 14,175Other(3),(4) — 12,774 — 37,957 — — 5716,466 $ 3,660,207 $ 222.24 $ 3,176,236 $ 192.85 86.8% $ 128,581Year Ended December 31, 2008Member Premium Revenue Medical Care Costs Medical Premium TaxMonths(1) Total PMPM Total PMPM Care Ratio ExpenseCalifornia 3,721 $ 417,027 $ 112.06 $ 363,776 $ 97.75 87.2% $ 12,503Florida(2) — — — — — — —Michigan 2,526 509,782 201.86 405,683 160.64 79.6 31,760Missouri 910 225,280 247.62 184,298 202.58 81.8 —New Mexico 970 348,576 359.45 286,004 294.92 82.1 11,713Ohio 1,998 602,826 301.76 549,182 274.91 91.1 30,505Texas 348 110,178 316.32 84,324 242.09 76.5 1,995Utah 659 155,991 236.75 139,011 210.98 89.1 —Washington 3,514 709,943 202.02 575,085 163.64 81.0 11,668Other(3),(4) — 11,637 — 33,949 — — 2114,646 $ 3,091,240 $ 210.97 $ 2,621,312 $ 178.90 84.8% $ 100,165(1) A member month is defined as the aggregate of each month’s ending membership for the period presented.(2) The Florida health plan began enrolling members in December 2008.(3) “Other” medical care costs also include medically related administrative costs at the parent company.(4) As of December 31, 2009, our Nevada health plan no longer served members. Premium revenue and medical care costs for the Nevada health plan have been included in“Other.”51Table of ContentsGeneral and administrative expensesG&A expenses were 7.5% of revenue in the year ended December 31, 2009, compared with 8.0% for the year ended December 31, 2008. Year-over-year, premiumrevenue grew faster than administrative costs, causing administrative costs, as a percentage of revenue, to decrease. On a PMPM basis, G&A decreased to $16.76 in 2009, from$17.04 for the same period in 2008.Year Ended December 31,2009 2008% of Total % of TotalAmount Revenue Amount Revenue(In thousands)Medicare-related administrative costs $ 18,857 0.5% $ 18,451 0.6%Non Medicare-related administrative costs:Administrative payroll, including employee incentive compensation 205,396 5.6 190,932 6.1Florida health plan start up expenses — — 2,495 0.1All other administrative expense 51,774 1.4 37,768 1.2G&A expenses $ 276,027 7.5% $ 249,646 8.0%Depreciation and AmortizationDepreciation and amortization expense increased $4.4 million for the year ended December 31, 2009 compared with 2008, primarily due to depreciation expenseassociated with investments in infrastructure. The following table presents the components of depreciation and amortization:Year Ended December 31,2009 2008% of Total % of TotalAmount Revenue Amount Revenue(In thousands)Depreciation $ 25,172 0.7% $ 20,718 0.7%Amortization of intangible assets 12,938 0.3 12,970 0.4Depreciation and amortization reported in the consolidated statements of cash flows $ 38,110 1.0% $ 33,688 1.1%Gain on Retirement of Convertible Senior NotesIn February 2009, we purchased and retired $13.0 million face amount of our convertible senior notes. In connection with the purchase of the notes, we recorded a pretaxgain of $1.5 million in 2009. There was no comparable transaction in 2008.Interest ExpenseInterest expense was $13.8 million for the year ended December 31, 2009, a slight increase over interest expense of $13.2 million for the year ended December 31, 2008.Interest expense includes non-cash interest expense relating to our convertible senior notes, which totaled $4.8 million, and $4.7 million for the years ended December 31, 2009,and 2008, respectively.Income TaxesIncome taxes were recorded at an effective rate of 19.1% for the year ended December 31, 2009, compared with 36.8% in the prior year. The decrease in the effectivetax rate was primarily due to discrete tax benefits recognized during the year relating to settling tax examinations, and higher than previously estimated California enterprisezone tax credits.52Table of ContentsFor the years ended December 31, 2009 and 2008, amounts for premium tax expense and income tax expense have been reclassified to conform to the presentation ofMGRT as a premium tax. The MGRT amounted to $5.5 million and $5.1 million for the years ended December 31, 2009, and 2008, respectively. There was no impact to netincome for either period presented relating to this change.http://sec.gov/Archives/edgar/data/1179929/000095012311023069/a58840e10vk.htm[1/6/2012 11:08:51 AM]
e10vkAcquisitionsWisconsin Health Plan. On September 1, 2010, we acquired Abri Health Plan, a <strong>Medicaid</strong> managed care organization based in Milwaukee, Wisconsin. As ofDecember 31, 2010, we expect the final purchase price for the acquisition to be approximately $15.5 million, subject to adjustments. As of December 31, 2010, we had paid$8.5 million of the total purchase price. In the first quarter of 2011 we will compute the final purchase price based on the plan’s membership on that date.<strong>Molina</strong> <strong>Medicaid</strong> <strong>Solutions</strong>. On May 1, 2010, we acquired a health information management business which we now operate under the name, <strong>Molina</strong> <strong>Medicaid</strong><strong>Solutions</strong>SM as described in “Overview,” above.Florida Health Plan. On December 31, 2009, we acquired 100% of the voting equity interests in Florida NetPASS, LLC, or NetPASS. The final purchase price totaled$29.6 million.Liquidity and Capital ResourcesWe manage our cash, investments, and capital structure to meet the short- and long-term obligations of our business while maintaining liquidity and financial flexibility.We forecast, analyze, and monitor our cash flows to enable prudent investment management and financing within the confines of our financial strategy.Our regulated subsidiaries generate significant cash flows from premium revenue and investment income. Such cash flows are our primary source of liquidity. Thus, anyfuture decline in our premium revenue or our profitability may have a negative impact on our liquidity. We generally receive premium revenue in advance of the payment ofclaims for the related health care services. A majority of the assets held by our regulated subsidiaries are in the form of cash, cash equivalents, and investments. Afterconsidering expected cash flows from operating activities, we generally invest cash of regulated subsidiaries that exceeds our expected short-term obligations in longer term,investment-grade, marketable debt securities to improve our overall investment return. These investments are made pursuant to board approved investment policies whichconform to applicable state laws and regulations. Our investment policies are designed to provide liquidity, preserve capital, and maximize total return on invested assets, all ina manner consistent with state requirements that prescribe the types of instruments in which our subsidiaries may invest. These investment policies require that our investmentshave final maturities of five years or less (excluding auction rate securities and variable rate securities, for which interest rates are periodically reset) and that the averagematurity be two years or less. Professional portfolio managers operating under documented guidelines manage our investments. As of December 31, 2010, a substantial portionof our cash was invested in a portfolio of highly liquid money market securities, and our investments consisted solely of investment-grade debt securities. All of ourinvestments are classified as current assets, except for our investments in auction rate securities, which are classified as non-current assets. Our restricted investments areinvested principally in certificates of deposit and U.S. treasury securities.Investment income decreased to $6.3 million for the year ended December 31, 2010, compared with $9.1 million for year ended December 31, 2009. This decline wasprimarily due to lower interest rates in 2010. The annualized portfolio yields for the years ended December 31, 2010, 2009, and 2008, were 0.7%, 1.2%, and 3.0%,respectively.Investments and restricted investments are subject to interest rate risk and will decrease in value if market rates increase. We have the ability to hold our restrictedinvestments until maturity and, as a result, we would not expect to incur significantly losses due to a sudden change in market interest rates. Declines in interest rates over timewill reduce our investment income.Cash in excess of the capital needs of our regulated health plans is generally paid to our non-regulated parent company in the form of dividends, when and as permittedby applicable regulations, for general corporate use.53Table of ContentsCash provided by operating activities for the year ended December 31, 2010 was $161.6 million compared with $155.4 million for the year ended December 31, 2009,an increase of $6.2 million. Deferred revenue, which was a use of operating cash totaling $41.9 million in 2010, was a source of operating cash totaling $88.2 million in 2009.In 2009, the state of Ohio typically paid premiums in advance of the month the premium was earned. In 2010, the state of Ohio delayed its premium payments to mid-month forthe month premium is earned. Therefore, we did not receive advance payments for the Ohio health plan’s premiums during 2010. The change in deferred revenue was offset byincreases in net income, depreciation and amortization, and other current liabilities.Cash used in investing activities increased significantly in 2010 compared with 2009, due chiefly to the acquisition of <strong>Molina</strong> <strong>Medicaid</strong> <strong>Solutions</strong>, which totaled$131.3 million.Cash provided by financing activities increased due to funds generated by our equity offering in the third quarter of 2010, which totaled $111.1 million, net of issuancecosts. Amounts borrowed under our credit facility to fund the acquisition of <strong>Molina</strong> <strong>Medicaid</strong> <strong>Solutions</strong> in the second quarter of 2010 were repaid in the third quarter usingproceeds from the equity offering.Reconciliation of Non-GAAP(1) to GAAP Financial MeasuresEBITDA(2)Year EndedDecember 31,2010 2009(In thousands)Operating income $ 105,001 $ 51,934Add back:Depreciation and amortization reported in the consolidated statements of cash flows 60,765 38,110EBITDA $ 165,766 $ 90,044(1) GAAP stands for U.S. generally accepted accounting principles.(2) We calculate EBITDA consistently on a quarterly and annual basis by adding back depreciation and amortization to operating income. Operating income includesinvestment income. EBITDA is not prepared in conformity with GAAP because it excludes depreciation and amortization, as well as interest expense, and the provisionfor income taxes. This non-GAAP financial measure should not be considered as an alternative to the GAAP measures of net income, operating income, operating margin,or cash provided by operating activities, nor should EBITDA be considered in isolation from these GAAP measures of operating performance. Management uses EBITDAas a supplemental metric in evaluating our financial performance, in evaluating financing and business development decisions, and in forecasting and analyzing futureperiods. For these reasons, management believes that EBITDA is a useful supplemental measure to investors in evaluating our performance and the performance of othercompanies in our industry.Capital ResourcesAt December 31, 2010, the parent company — <strong>Molina</strong> Healthcare, Inc. — held cash and investments of approximately $65.1 million, including $6.0 million in noncurrentauction rate securities, compared with $45.6 million of cash and investments at December 31, 2009.On a consolidated basis, at December 31, 2010, we had working capital of $392.4 million compared with $321.2 million at December 31, 2009. At December 31, 2010and December 31, 2009, cash and cash equivalents were $455.9 million and $469.5 million, respectively. At December 31, 2010, investments were $315.8 million, including$20.4 million in non-current auction rate securities, and at December 31, 2009, investments were $234.5 million, including $59.7 million in non-current auction rate securities.54Table of ContentsCredit FacilityWe are a party to an Amended and Restated Credit Agreement, dated as of March 9, 2005, as amended by the first amendment on October 5, 2005, the secondamendment on November 6, 2006, the third amendment on May 25, 2008, the fourth amendment on April 29, 2010, and the fifth amendment on April 29, 2010, among <strong>Molina</strong>Healthcare Inc., certain lenders, and Bank of America N.A., as Administrative Agent (the “Credit Facility”) for a revolving credit line of $150 million that matures in May 2012.The Credit Facility is intended to be used for general corporate purposes. We borrowed $105 million under the Credit Facility to acquire <strong>Molina</strong> <strong>Medicaid</strong> <strong>Solutions</strong> in thesecond quarter of 2010. During the third quarter of 2010, we repaid this amount using proceeds from our equity offering, described in Note 14 to the accompanying auditedconsolidated financial statements for the year ended December 31, 2010. As of December 31, 2010, and 2009, there was no outstanding principal debt balance under the CreditFacility. However, as of December 31, 2010, our lenders had issued two letters of credit in the aggregate principal amount of $10.3 million in connection with the contract ofMMS with the states of Maine and Idaho.To the extent that in the future we incur any obligations under the Credit Facility, such obligations will be secured by a lien on substantially all of our assets and by apledge of the capital stock of our health plan subsidiaries (with the exception of the California health plan). The Credit Facility includes usual and customary covenants for creditfacilities of this type, including covenants limiting liens, mergers, asset sales, other fundamental changes, debt, acquisitions, dividends and other distributions, capitalexpenditures, investments, and a fixed charge coverage ratio. The Credit Facility also requires us to maintain a ratio of total consolidated debt to total consolidated EBITDA ofnot more than 2.75 to 1.00 at any time. At December 31, 2010, we were in compliance with all financial covenants in the Credit Facility.The commitment fee on the total unused commitments of the lenders under the Credit Facility is 50 basis points on all levels of the pricing grid, with the pricing gridreferring to our ratio of consolidated funded debt to consolidated EBITDA. The pricing for LIBOR loans and base rate loans is 200 basis points at every level of the pricing grid.Thus, the applicable margins under the Credit Facility range between 2.75% and 3.75% for LIBOR loans, and between 1.75% and 2.75% for base rate loans. The Credit Facilitycarves out from our indebtedness and restricted payment covenants under the Credit Facility the $187.0 million current principal amount of the convertible senior notes, althoughthe $187.0 million indebtedness is included in the calculation of our consolidated leverage ratio. The fixed charge coverage ratio set forth pursuant to the Credit Facility was2.75x (on a pro forma basis) at December 31, 2009, and 3.00x thereafter.http://sec.gov/Archives/edgar/data/1179929/000095012311023069/a58840e10vk.htm[1/6/2012 11:08:51 AM]
- Page 1:
Molina Medicaid SolutionsResponse t
- Page 7 and 8:
Bridging the Rivers ofChange Togeth
- Page 9 and 10:
Bridging the Rivers ofChange Togeth
- Page 11 and 12:
Bridging the Rivers ofChange Togeth
- Page 13 and 14:
Bridging the Rivers ofChange Togeth
- Page 15 and 16:
Bridging the Rivers ofChange Togeth
- Page 17 and 18:
Bridging the Rivers ofChange Togeth
- Page 19 and 20:
Bridging the Rivers ofChange Togeth
- Page 21 and 22:
Bridging the Rivers ofChange Togeth
- Page 23 and 24:
Bridging the Rivers ofChange Togeth
- Page 25 and 26:
Bridging the Rivers ofChange Togeth
- Page 27 and 28:
Bridging the Rivers ofChange Togeth
- Page 29 and 30:
Bridging the Rivers ofChange Togeth
- Page 31 and 32:
Bridging the Rivers ofChange Togeth
- Page 33 and 34:
Bridging the Rivers ofChange Togeth
- Page 35 and 36:
Bridging the Rivers ofChange Togeth
- Page 37 and 38:
Bridging the Rivers ofChange Togeth
- Page 39 and 40:
Bridging the Rivers ofChange Togeth
- Page 41 and 42:
Bridging the Rivers ofChange Togeth
- Page 43 and 44:
Bridging the Rivers ofChange Togeth
- Page 45 and 46:
Bridging the Rivers ofChange Togeth
- Page 47 and 48:
Bridging the Rivers ofChange Togeth
- Page 49 and 50:
Bridging the Rivers ofChange Togeth
- Page 51 and 52:
Bridging the Rivers ofChange Togeth
- Page 53 and 54:
Bridging the Rivers ofChange Togeth
- Page 55 and 56:
Bridging the Rivers ofChange Togeth
- Page 57 and 58:
Bridging the Rivers ofChange Togeth
- Page 59 and 60:
Bridging the Rivers ofChange Togeth
- Page 61 and 62:
Bridging the Rivers ofChange Togeth
- Page 63 and 64:
Bridging the Rivers ofChange Togeth
- Page 65 and 66:
Bridging the Rivers ofChange Togeth
- Page 67 and 68:
Bridging the Rivers ofChange Togeth
- Page 69 and 70:
Bridging the Rivers ofChange Togeth
- Page 71 and 72:
Bridging the Rivers ofChange Togeth
- Page 73 and 74:
Bridging the Rivers ofChange Togeth
- Page 75 and 76:
Bridging the Rivers ofChange Togeth
- Page 77 and 78:
Bridging the Rivers ofChange Togeth
- Page 79 and 80:
Bridging the Rivers ofChange Togeth
- Page 81 and 82:
Bridging the Rivers ofChange Togeth
- Page 83 and 84:
Bridging the Rivers ofChange Togeth
- Page 85 and 86:
Bridging the Rivers ofChange Togeth
- Page 87 and 88:
Bridging the Rivers ofChange Togeth
- Page 89 and 90:
Bridging the Rivers ofChange Togeth
- Page 91 and 92:
Bridging the Rivers ofChange Togeth
- Page 93 and 94:
Bridging the Rivers ofChange Togeth
- Page 95 and 96:
Bridging the Rivers ofChange Togeth
- Page 97 and 98:
Bridging the Rivers ofChange Togeth
- Page 99 and 100:
Bridging the Rivers ofChange Togeth
- Page 101 and 102:
Bridging the Rivers ofChange Togeth
- Page 103 and 104:
Bridging the Rivers ofChange Togeth
- Page 105 and 106:
Bridging the Rivers ofChange Togeth
- Page 107 and 108:
Bridging the Rivers ofChange Togeth
- Page 109 and 110:
Bridging the Rivers ofChange Togeth
- Page 111 and 112:
Bridging the Rivers ofChange Togeth
- Page 113 and 114:
Bridging the Rivers ofChange Togeth
- Page 115 and 116:
Bridging the Rivers ofChange Togeth
- Page 117 and 118:
Bridging the Rivers ofChange Togeth
- Page 119 and 120:
Bridging the Rivers ofChange Togeth
- Page 121 and 122:
Bridging the Rivers ofChange Togeth
- Page 123 and 124:
Bridging the Rivers ofChange Togeth
- Page 125 and 126:
Bridging the Rivers ofChange Togeth
- Page 127 and 128:
Bridging the Rivers ofChange Togeth
- Page 129 and 130:
Bridging the Rivers ofChange Togeth
- Page 131 and 132:
Bridging the Rivers ofChange Togeth
- Page 133 and 134:
Bridging the Rivers ofChange Togeth
- Page 135 and 136:
Bridging the Rivers ofChange Togeth
- Page 137 and 138:
Bridging the Rivers ofChange Togeth
- Page 139 and 140:
Bridging the Rivers ofChange Togeth
- Page 141 and 142:
Bridging the Rivers ofChange Togeth
- Page 143 and 144:
Bridging the Rivers ofChange Togeth
- Page 145 and 146:
Bridging the Rivers ofChange Togeth
- Page 147 and 148:
Bridging the Rivers ofChange Togeth
- Page 149 and 150:
Bridging the Rivers ofChange Togeth
- Page 151 and 152:
Bridging the Rivers ofChange Togeth
- Page 153 and 154:
Bridging the Rivers ofChange Togeth
- Page 155 and 156:
Bridging the Rivers ofChange Togeth
- Page 157 and 158:
Bridging the Rivers ofChange Togeth
- Page 159 and 160:
Bridging the Rivers ofChange Togeth
- Page 161 and 162:
Bridging the Rivers ofChange Togeth
- Page 163 and 164:
Bridging the Rivers ofChange Togeth
- Page 165 and 166:
Bridging the Rivers ofChange Togeth
- Page 167 and 168:
Bridging the Rivers ofChange Togeth
- Page 169 and 170:
Bridging the Rivers ofChange Togeth
- Page 171 and 172:
Bridging the Rivers ofChange Togeth
- Page 173 and 174:
Bridging the Rivers ofChange Togeth
- Page 175 and 176:
Bridging the Rivers ofChange Togeth
- Page 177 and 178:
Bridging the Rivers ofChange Togeth
- Page 179 and 180:
Bridging the Rivers ofChange Togeth
- Page 181 and 182:
Bridging the Rivers ofChange Togeth
- Page 183 and 184:
Bridging the Rivers ofChange Togeth
- Page 185 and 186:
Bridging the Rivers ofChange Togeth
- Page 187 and 188:
Bridging the Rivers ofChange Togeth
- Page 189 and 190:
Bridging the Rivers ofChange Togeth
- Page 191 and 192:
Bridging the Rivers ofChange Togeth
- Page 193 and 194:
Bridging the Rivers ofChange Togeth
- Page 195 and 196:
Bridging the Rivers ofChange Togeth
- Page 197 and 198:
Bridging the Rivers ofChange Togeth
- Page 199 and 200:
Bridging the Rivers ofChange Togeth
- Page 201 and 202:
Bridging the Rivers ofChange Togeth
- Page 203 and 204:
Bridging the Rivers ofChange Togeth
- Page 205 and 206:
Bridging the Rivers ofChange Togeth
- Page 207 and 208:
Bridging the Rivers ofChange Togeth
- Page 209 and 210:
Bridging the Rivers ofChange Togeth
- Page 211 and 212:
Bridging the Rivers ofChange Togeth
- Page 213 and 214:
Bridging the Rivers ofChange Togeth
- Page 215 and 216:
Bridging the Rivers ofChange Togeth
- Page 217 and 218:
Bridging the Rivers ofChange Togeth
- Page 219 and 220:
Bridging the Rivers ofChange Togeth
- Page 221 and 222:
Bridging the Rivers ofChange Togeth
- Page 223 and 224:
Bridging the Rivers ofChange Togeth
- Page 225 and 226:
Bridging the Rivers ofChange Togeth
- Page 227 and 228:
Bridging the Rivers ofChange Togeth
- Page 229 and 230:
Bridging the Rivers ofChange Togeth
- Page 231 and 232:
Bridging the Rivers ofChange Togeth
- Page 233 and 234:
Bridging the Rivers ofChange Togeth
- Page 235 and 236:
Bridging the Rivers ofChange Togeth
- Page 237 and 238:
Bridging the Rivers ofChange Togeth
- Page 239 and 240:
Bridging the Rivers ofChange Togeth
- Page 241 and 242:
Bridging the Rivers ofChange Togeth
- Page 243 and 244:
Bridging the Rivers ofChange Togeth
- Page 245 and 246:
Bridging the Rivers ofChange Togeth
- Page 247 and 248:
Bridging the Rivers ofChange Togeth
- Page 249 and 250:
Bridging the Rivers ofChange Togeth
- Page 265:
Bridging the Rivers ofChange Togeth
- Page 272 and 273:
Bridging the Rivers ofChange Togeth
- Page 274 and 275:
Bridging the Rivers ofChange Togeth
- Page 276 and 277:
Bridging the Rivers ofChange Togeth
- Page 278 and 279:
Bridging the Rivers ofChange Togeth
- Page 280 and 281:
Bridging the Rivers ofChange Togeth
- Page 282 and 283:
Bridging the Rivers ofChange Togeth
- Page 284 and 285:
Bridging the Rivers ofChange Togeth
- Page 286 and 287:
Bridging the Rivers ofChange Togeth
- Page 288 and 289:
Bridging the Rivers ofChange Togeth
- Page 290 and 291:
Bridging the Rivers ofChange Togeth
- Page 292 and 293:
Bridging the Rivers ofChange Togeth
- Page 294 and 295:
Bridging the Rivers ofChange Togeth
- Page 296 and 297:
Bridging the Rivers ofChange Togeth
- Page 298 and 299:
Bridging the Rivers ofChange Togeth
- Page 300 and 301:
Bridging the Rivers ofChange Togeth
- Page 302 and 303:
Bridging the Rivers ofChange Togeth
- Page 304 and 305:
Bridging the Rivers ofChange Togeth
- Page 306 and 307:
Bridging the Rivers ofChange Togeth
- Page 308 and 309:
Bridging the Rivers ofChange Togeth
- Page 310 and 311:
Bridging the Rivers ofChange Togeth
- Page 312 and 313:
Bridging the Rivers ofChange Togeth
- Page 314 and 315:
Bridging the Rivers ofChange Togeth
- Page 316 and 317:
Bridging the Rivers ofChange Togeth
- Page 318 and 319:
Bridging the Rivers ofChange Togeth
- Page 320 and 321:
Bridging the Rivers ofChange Togeth
- Page 322 and 323:
Bridging the Rivers ofChange Togeth
- Page 324 and 325:
Bridging the Rivers ofChange Togeth
- Page 326 and 327:
Bridging the Rivers ofChange Togeth
- Page 328 and 329:
Bridging the Rivers ofChange Togeth
- Page 330 and 331:
Bridging the Rivers ofChange Togeth
- Page 332 and 333:
Bridging the Rivers ofChange Togeth
- Page 334 and 335:
Bridging the Rivers ofChange Togeth
- Page 336 and 337:
e10vkTable of ContentsItem 1:Overvi
- Page 338 and 339:
e10vkDepartment of Health Services
- Page 340 and 341:
e10vkservices, and reputation or na
- Page 342 and 343:
e10vkIf our government contracts ar
- Page 344 and 345:
e10vkIf our cost increases resultin
- Page 346 and 347:
e10vkour board of directors. Becaus
- Page 348 and 349:
e10vkFirst Quarter $ 44.94 $ 23.46S
- Page 350 and 351:
e10vkTable of ContentsCertain compo
- Page 352 and 353:
e10vkNevada 8,037 1,106.45 9,099 1,
- Page 354 and 355:
e10vkInvestment IncomeInvestment in
- Page 356 and 357:
e10vkand 2007, respectively. EBITDA
- Page 358 and 359:
e10vk$2.8 million, or $0.10 per dil
- Page 360 and 361:
e10vkREPORT OF INDEPENDENT REGISTER
- Page 362 and 363:
e10vk65Table of ContentsMOLINA HEAL
- Page 364 and 365:
e10vkDelegated Provider InsolvencyC
- Page 366 and 367:
e10vk2007 (see Note 11, “Long-Ter
- Page 368 and 369:
e10vk$ 252,380 $ 248,039Gross reali
- Page 370 and 371:
e10vkTable of ContentsMOLINA HEALTH
- Page 372 and 373:
e10vk$10.9 million, and $7.9 millio
- Page 374 and 375:
e10vkIn July 2008, our board of dir
- Page 376 and 377:
e10vkThe Registrant has an equity i
- Page 378 and 379:
e10vkSIGNATURESPursuant to the requ
- Page 380 and 381:
exv12w1EX-12.1 2 a51362exv12w1.htm
- Page 382 and 383:
exv23w1EX-23.1 4 a51362exv23w1.htm
- Page 384 and 385:
exv31w2EX-31.2 6 a51362exv31w2.htm
- Page 386 and 387:
exv32w2EX-32.2 8 a51362exv32w2.htm
- Page 388 and 389:
e10vkEX-31.1EX-31.2EX-32.1EX-32.2Ta
- Page 390 and 391:
e10vkLeverage operational efficienc
- Page 392 and 393:
e10vkhealth plans. Among such facto
- Page 394 and 395:
e10vkMissouri and Ohio health plans
- Page 396 and 397:
e10vkWe are subject to various rout
- Page 398 and 399:
e10vkIt may be difficult for a thir
- Page 400 and 401:
e10vkItem 5:PART IIMarket for Regis
- Page 402 and 403:
e10vkstates to exclude certain bene
- Page 404 and 405:
e10vkMedical care ratio 86.8% 84.8%
- Page 406 and 407:
e10vkTable of ContentsMedical care
- Page 408 and 409:
e10vkare required to pay a fee for
- Page 410 and 411:
e10vkknown. While we believe our cu
- Page 412 and 413:
e10vkTable of ContentsMOLINA HEALTH
- Page 414 and 415:
e10vkYear Ended December 31,2009 20
- Page 416 and 417:
e10vkCalifornia $ 481,717 $ 417,027
- Page 418 and 419:
e10vkMOLINA HEALTHCARE, INC.NOTES T
- Page 420 and 421:
e10vk2008, we had transitioned fewe
- Page 422 and 423:
e10vknot intend to sell, nor is it
- Page 424 and 425:
e10vk87Table of ContentsMOLINA HEAL
- Page 426 and 427:
e10vkDuring 2009, 2008, and 2007, t
- Page 428 and 429:
e10vk$29.17 - $30.05 9,350 5.9 $ 29
- Page 430 and 431:
e10vk(1) The Registrant’s condens
- Page 432 and 433:
e10vkChanges in Internal Controls:
- Page 434 and 435:
e10vkSignature Title Date/s/ Joseph
- Page 436 and 437:
exv10w22Commitments exceed the sum
- Page 438 and 439:
exv10w22Loan Document. The amendmen
- Page 440 and 441:
exv10w22Name:Title:Fifth Amendment
- Page 442 and 443:
exv10w22Fifth Amendment to Credit A
- Page 444 and 445:
exv10w24EX-10.24 3 a55407exv10w24.h
- Page 446 and 447:
exv10w24Molina ECMS ref# 729 Provid
- Page 448 and 449:
exv10w24Molina ECMS ref# 729 Provid
- Page 450 and 451:
exv10w24HSA — Hospital Services A
- Page 452 and 453:
exv10w243.2 Member Eligibility Dete
- Page 454 and 455:
exv10w245.6 Amendment. Health Plan
- Page 456 and 457:
exv10w24HSA — Hospital Services A
- Page 458 and 459:
exv10w24License No. StreetNPI (or U
- Page 460 and 461:
exv10w24Page 23 of 40ATTACHMENT CPr
- Page 462 and 463:
exv10w24• This reimbursement meth
- Page 464 and 465:
exv10w24Molina ECMS ref# 729 Provid
- Page 466 and 467:
exv10w24(Rule 53250(e)(4))8. Provid
- Page 468 and 469:
exv10w241. Right to Audit. Provider
- Page 470 and 471: exv10w24Treasurer G. William Hammer
- Page 472 and 473: exv10w25unless the situation is one
- Page 474 and 475: exv10w25Plan in identifying, proces
- Page 476 and 477: exv10w25Page 9that the offset and r
- Page 478 and 479: exv10w25under this Agreement.h. Hea
- Page 480 and 481: exv10w25Page 16Date 6/1/06ATTACHMEN
- Page 482 and 483: exv10w25that Provider is de-delegat
- Page 484 and 485: exv10w25the subscriber or Member by
- Page 486 and 487: exv10w25discretion, that Provider h
- Page 488 and 489: exv10w252.5 Annual Disclosure of Ca
- Page 490 and 491: exv10w25Initials of authorizedrepre
- Page 492 and 493: exv10w25the report is true and corr
- Page 494 and 495: exv21w1EX-21.1 6 a55407exv21w1.htm
- Page 496 and 497: exv31w1EX-31.1 8 a55407exv31w1.htm
- Page 498 and 499: exv32w1EX-32.1 10 a55407exv32w1.htm
- Page 500 and 501: e10vk10-K 1 a58840e10vk.htm FORM 10
- Page 502 and 503: e10vkOur StrengthsWe focus on servi
- Page 504 and 505: e10vkevent.CompetitionWe operate in
- Page 506 and 507: e10vkat the funding for these healt
- Page 508 and 509: e10vk18Table of ContentsAlso, many
- Page 510 and 511: e10vkTable of Contentsalleged non-c
- Page 512 and 513: e10vk(fair value of $20.4 million).
- Page 514 and 515: e10vkTable of ContentsSTOCK PERFORM
- Page 516 and 517: e10vkAs of December 31, 2010, our h
- Page 519: e10vkYear Ended December 31,2010 20
- Page 523 and 524: e10vkspecific performance measures
- Page 525 and 526: e10vkoverestimations were tied to o
- Page 527 and 528: e10vkIntangible assets, net 105,500
- Page 529 and 530: e10vkOur Health Plans segment compr
- Page 531 and 532: e10vkSituations may arise where the
- Page 533 and 534: e10vkinvestment fund. As of Decembe
- Page 535 and 536: e10vk87Table of ContentsMOLINA HEAL
- Page 537 and 538: e10vk7. ReceivablesHealth Plans seg
- Page 539 and 540: e10vkTable of ContentsMOLINA HEALTH
- Page 541 and 542: e10vkindebtedness under the Credit
- Page 543 and 544: e10vkstatutory capital and surplus
- Page 545 and 546: e10vkCash paid in business purchase
- Page 547 and 548: e10vkItem 12.Security Ownership of
- Page 549 and 550: exv10w27EX-10.27 2 a58840exv10w27.h
- Page 551 and 552: exv10w27(f) all transferable or ass
- Page 553 and 554: exv10w27and other charges have been
- Page 555 and 556: exv10w27under or affecting the Prop
- Page 557 and 558: exv10w27BY A GENERAL RELEASE, WHICH
- Page 559 and 560: exv10w27(f) Seller’s share of the
- Page 561 and 562: exv10w2710.6 Items Not to be Prorat
- Page 563 and 564: exv10w27- 21 -(i) Delinquency Repor
- Page 565 and 566: exv10w27executed, and delivered by
- Page 567 and 568: exv10w27MATERIALS THAT PERTAIN TO T
- Page 569 and 570: exv10w27Attn: General CounselTeleph
- Page 571 and 572:
exv10w2718.16 Authority. The indivi
- Page 573 and 574:
exv12w1EX-12.1 3 a58840exv12w1.htm
- Page 575 and 576:
exv23w1EX-23.1 5 a58840exv23w1.htm
- Page 577 and 578:
exv31w2EX-31.2 7 a58840exv31w2.htm
- Page 579:
exv32w2EX-32.2 9 a58840exv32w2.htm