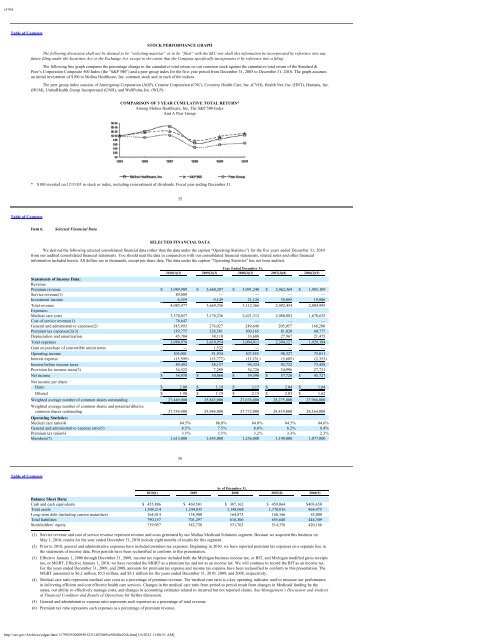
e10vkTable of ContentsSTOCK PERFORMANCE GRAPHThe following discussion shall not be deemed to be “soliciting material” or to be “filed” with the SEC nor shall this information be incorporated by reference into anyfuture filing under the Securities Act or the Exchange Act, except to the extent that the Company specifically incorporates it by reference into a filing.The following line graph compares the percentage change in the cumulative total return on our common stock against the cumulative total return of the Standard &Poor’s Corporation Composite 500 Index (the “S&P 500”) and a peer group index for the five-year period from December 31, 2005 to December 31, 2010. The graph assumesan initial investment of $100 in <strong>Molina</strong> Healthcare, Inc. common stock and in each of the indices.The peer group index consists of Amerigroup Corporation (AGP), Centene Corporation (CNC), Coventry Health Care, Inc. (CVH), Health Net, Inc. (HNT), Humana, Inc.(HUM), UnitedHealth Group Incorporated (UNH), and WellPoint, Inc. (WLP).COMPARISON OF 5 YEAR CUMULATIVE TOTAL RETURN*Among <strong>Molina</strong> Healthcare, Inc, The S&P 500 IndexAnd A Peer Group* $100 invested on 12/31/05 in stock or index, including reinvestment of dividends. Fiscal year ending December 31.35Table of ContentsItem 6.Selected Financial DataSELECTED FINANCIAL DATAWe derived the following selected consolidated financial data (other than the data under the caption “Operating Statistics”) for the five years ended December 31, 2010from our audited consolidated financial statements. You should read the data in conjunction with our consolidated financial statements, related notes and other financialinformation included herein. All dollars are in thousands, except per share data. The data under the caption “Operating Statistics” has not been audited.Year Ended December 31,2010(1)(3) 2009(2)(3) 2008(2)(3) 2007(2)(8) 2006(2)(9)Statements of Income Data:Revenue:Premium revenue $ 3,989,909 $ 3,660,207 $ 3,091,240 $ 2,462,369 $ 1,985,109Service revenue(1) 89,809 — — — —Investment income 6,259 9,149 21,126 30,085 19,886Total revenue 4,085,977 3,669,356 3,112,366 2,492,454 2,004,995Expenses:Medical care costs 3,370,857 3,176,236 2,621,312 2,080,083 1,678,652Cost of service revenue(1) 78,647 — — — —General and administrative expenses(2) 345,993 276,027 249,646 205,057 168,280Premium tax expenses(2)(3) 139,775 128,581 100,165 81,020 60,777Depreciation and amortization 45,704 38,110 33,688 27,967 21,475Total expenses 3,980,976 3,618,954 3,004,811 2,394,127 1,929,184Gain on purchase of convertible senior notes — 1,532 — — —Operating income 105,001 51,934 107,555 98,327 75,811Interest expense (15,509) (13,777) (13,231) (5,605) (2,353)Income before income taxes 89,492 38,157 94,324 92,722 73,458Provision for income taxes(3) 34,522 7,289 34,726 34,996 27,731Net income $ 54,970 $ 30,868 $ 59,598 $ 57,726 $ 45,727Net income per share:Basic $ 2.00 $ 1.19 $ 2.15 $ 2.04 $ 1.64Diluted $ 1.98 $ 1.19 $ 2.15 $ 2.03 $ 1.62Weighted average number of common shares outstanding 27,449,000 25,843,000 27,676,000 28,275,000 27,966,000Weighted average number of common shares and potential dilutivecommon shares outstanding 27,754,000 25,984,000 27,772,000 28,419,000 28,164,000Operating Statistics:Medical care ratio(4) 84.5% 86.8% 84.8% 84.5% 84.6%General and administrative expense ratio(5) 8.5% 7.5% 8.0% 8.2% 8.4%Premium tax ratio(6) 3.5% 3.5% 3.2% 3.3% 2.3%Members(7) 1,613,000 1,455,000 1,256,000 1,149,000 1,077,00036Table of ContentsAs of December 31,2010(1) 2009 2008 2007(8) 2006(9)Balance Sheet Data:Cash and cash equivalents $ 455,886 $ 469,501 $ 387,162 $ 459,064 $403,650Total assets 1,509,214 1,244,035 1,148,068 1,170,016 864,475Long-term debt (including current maturities) 164,014 158,900 164,873 160,166 45,000Total liabilities 790,157 701,297 616,306 655,640 444,309Stockholders’ equity 719,057 542,738 531,762 514,376 420,166(1) Service revenue and cost of service revenue represent revenue and costs generated by our <strong>Molina</strong> <strong>Medicaid</strong> <strong>Solutions</strong> segment. Because we acquired this business onMay 1, 2010, results for the year ended December 31, 2010 include eight months of results for this segment.(2) Prior to 2010, general and administrative expenses have included premium tax expenses. Beginning in 2010, we have reported premium tax expenses on a separate line inthe statements of income data. Prior periods have been reclassified to conform to this presentation.(3) Effective January 1, 2008 through December 31, 2009, income tax expense included both the Michigan business income tax, or BIT, and Michigan modified gross receiptstax, or MGRT. Effective January 1, 2010, we have recorded the MGRT as a premium tax and not as an income tax. We will continue to record the BIT as an income tax.For the years ended December 31, 2009, and 2008, amounts for premium tax expense and income tax expense have been reclassified to conform to this presentation. TheMGRT amounted to $6.2 million, $5.5 million, and $5.1 million for the years ended December 31, 2010, 2009, and 2008, respectively.(4) Medical care ratio represents medical care costs as a percentage of premium revenue. The medical care ratio is a key operating indicator used to measure our performancein delivering efficient and cost effective health care services. Changes in the medical care ratio from period to period result from changes in <strong>Medicaid</strong> funding by thestates, our ability to effectively manage costs, and changes in accounting estimates related to incurred but not reported claims. See Management’s Discussion and Analysisof Financial Condition and Results of Operations for further discussion.(5) General and administrative expense ratio represents such expenses as a percentage of total revenue.(6) Premium tax ratio represents such expenses as a percentage of premium revenue.http://sec.gov/Archives/edgar/data/1179929/000095012311023069/a58840e10vk.htm[1/6/2012 11:08:51 AM]
e10vk(7) Number of members at end of period.(8) The balance sheet and operating results of the Mercy CarePlus acquisition, relating to our Missouri health plan, have been included since November 1, 2007, the effectivedate of the acquisition.(9) The balance sheet and operating results of the Cape Health Plan acquisition, relating to our Michigan health plan, have been included since May 15, 2006, the effectivedate of the acquisition.37Table of ContentsItem 7.Management’s Discussion and Analysis of Financial Condition and Results of OperationsThe following discussion of our financial condition and results of operations should be read in conjunction with the “Selected Financial Data” and the accompanyingconsolidated financial statements and the notes to those statements appearing elsewhere in this report. This discussion contains forward-looking statements that involve knownand unknown risks and uncertainties, including those set forth under Item 1A — Risk Factors, above.ReclassificationsEffective January 1, 2010, we have recorded the Michigan modified gross receipts tax, or MGRT, as a premium tax and not as an income tax. Prior periods have beenreclassified to conform to this presentation.In prior periods, general and administrative, or G&A, expenses have included premium tax expenses. Beginning in 2010, we have reported premium tax expenses on aseparate line in the accompanying consolidated statements of income. Prior periods have been reclassified to conform to this presentation.Overview<strong>Molina</strong> Healthcare, Inc. provides quality and cost-effective <strong>Medicaid</strong>-related solutions to meet the health care needs of low-income families and individuals, and to assiststate agencies in their administration of the <strong>Medicaid</strong> program. Our business comprises our Health Plans segment, consisting of licensed health maintenance organizationsserving <strong>Medicaid</strong> populations in ten states, and our <strong>Molina</strong> <strong>Medicaid</strong> <strong>Solutions</strong> segment, which provides design, development, implementation, and business processingsolutions to <strong>Medicaid</strong> agencies in an additional five states. Our direct delivery business currently consists of 16 primary care community clinics in California and two primarycare community clinics in Washington, and we also manage three county-owned primary care clinics under a contract with Fairfax County, Virginia.Our Health Plans segment comprises health plans in California, Florida, Michigan, Missouri, New Mexico, Ohio, Texas, Utah, Washington, and Wisconsin. These healthplans served approximately 1.6 million members eligible for <strong>Medicaid</strong>, Medicare, and other government-sponsored health care programs for low-income families andindividuals as of December 31, 2010. The health plans are operated by our respective wholly owned subsidiaries in those states, each of which is licensed as a healthmaintenance organization, or HMO. Effective January 1, 2010, we terminated operations at our small Medicare health plan in Nevada.On May 1, 2010, we acquired a health information management business which we now operate under the name, <strong>Molina</strong> <strong>Medicaid</strong> <strong>Solutions</strong>SM. Our <strong>Molina</strong> <strong>Medicaid</strong><strong>Solutions</strong> segment provides design, development, implementation, and business process outsourcing solutions to state governments for their <strong>Medicaid</strong> Management InformationSystems, or MMIS. MMIS is a core tool used to support the administration of state <strong>Medicaid</strong> and other health care entitlement programs. <strong>Molina</strong> <strong>Medicaid</strong> <strong>Solutions</strong> currentlyholds MMIS contracts with the states of Idaho, Louisiana, Maine, New Jersey, and West Virginia, as well as a contract to provide drug rebate administration services for theFlorida <strong>Medicaid</strong> program. We paid $131.3 million to acquire <strong>Molina</strong> <strong>Medicaid</strong> <strong>Solutions</strong>. The acquisition was funded with available cash of $26 million and $105 milliondrawn under our credit facility.With the addition of <strong>Molina</strong> <strong>Medicaid</strong> <strong>Solutions</strong>, we have added a segment to our internal financial reporting structure in 2010. We now report our financial performancebased on the following two reportable segments: (i) Health Plans; and (ii) <strong>Molina</strong> <strong>Medicaid</strong> <strong>Solutions</strong>.Fiscal Year 2010 Overview and HighlightsDuring 2010, we experienced diversified revenue growth thanks to increased enrollment in our health plans, our successful entry into the <strong>Medicaid</strong> health informationmanagement business, and an acquisition that established us in a new state. Meanwhile, stronger medical management and disciplined cost control helped us realizeimprovements in our health plan medical margins. Many of these factors contributed to our Company’s strong financial performance in 2010. For the year, our net income roseto $55.0 million, or $1.98 per diluted share, an increase of 78% over 2009. We earned premium revenues of $4.0 billion, up 9% over the previous year. Meanwhile, during ayear when costs continued to rise for the health care industry, we achieved a medical care ratio of 84.5%, compared with a medical care ratio of 86.8% for fiscal year 2009.38Table of ContentsDuring 2010, we continued to pursue the expansion of our <strong>Medicaid</strong> health plan business. In September 2010, we completed the $15.5 million acquisition of Abri HealthPlan of Milwaukee, which served approximately 36,000 <strong>Medicaid</strong> beneficiaries as of December 31, 2010. We also expanded our growing presence in Texas, where we werealready serving patients in the Houston, San Antonio, and Laredo service areas. In May 2010, we were awarded a contract to serve <strong>Medicaid</strong> managed care patients in theseven-county Dallas service area starting in February 2011. In September 2010, we won an additional contract to administer the CHIP program (including the CHIP Perinatalprogram) in 174 predominately rural counties across the state. As of December 31, 2010, we served approximately 63,000 children and pregnant women under this contract.The new contracts not only provide increased scale for leveraging our resources in Texas, they make <strong>Molina</strong> an increasingly important player in a state where the potentialrevenue opportunity will grow as new <strong>Medicaid</strong> beneficiaries qualify for coverage under health care reform.In addition, during 2010 we expanded our operation of community-based primary care clinics — the business field in which <strong>Molina</strong> began over 30 years ago — so thatwe can serve the needs of our patients while also serving the states that pay for their health care.Finally, on May 1, 2010, we acquired <strong>Molina</strong> <strong>Medicaid</strong> <strong>Solutions</strong>, an acquisition which has complemented our core business model of serving government programs,expanded our service offerings diversified our revenue base, and expanded our level of participation in the <strong>Medicaid</strong> program.2010 Financial Performance SummaryThe following table briefly summarizes our financial performance for the years ended December 31, 2010, 2009, and 2008. All ratios, with the exception of the medicalcare ratio and the premium tax ratio, are shown as a percentage of total revenue. The medical care ratio and the premium tax ratio are computed as a percentage of premiumrevenue because there are direct relationships between premium revenue earned, and the cost of health care and premium taxes.Year Ended December 31,2010 2009 2008(Dollar amounts in thousands, except per-share data)Earnings per diluted share $ 1.98 $ 1.19 $ 2.15Premium revenue $ 3,989,909 $ 3,660,207 $ 3,091,240Service revenue $ 89,809 $ — $ —Operating income $ 105,001 $ 51,934 $ 107,555Net income $ 54,970 $ 30,868 $ 59,598Total ending membership 1,613,000 1,455,000 1,256,000Premium revenue 97.6% 99.8% 99.3%Service revenue 2.2 — —Investment income 0.2 0.2 0.7Total revenue 100.0% 100.0% 100.0%Medical care ratio 84.5% 86.8% 84.8%General and administrative expense ratio 8.5% 7.5% 8.0%Premium tax ratio 3.5% 3.5% 3.2%Operating income 2.6% 1.4% 3.5%Net income 1.3% 0.8% 1.9%Effective tax rate 38.6% 19.1% 36.8%Health Plans SegmentOur Health Plans segment derives its revenue, in the form of premiums, chiefly from <strong>Medicaid</strong> contracts with the states in which our health plans operate. The majorityof medical costs associated with premium revenues are risk-based costs — while the health plans receive fixed per-member per-month, or PMPM, premium payments from thestates, the health plans are at risk for the costs of their members’ health care. Our Health Plans segment operates39Table of Contentsin a highly regulated environment with stringent capitalization requirements. These capitalization requirements, among other things, limit the health plans’ ability to paydividends to us without regulatory approval.http://sec.gov/Archives/edgar/data/1179929/000095012311023069/a58840e10vk.htm[1/6/2012 11:08:51 AM]
- Page 1:
Molina Medicaid SolutionsResponse t
- Page 7 and 8:
Bridging the Rivers ofChange Togeth
- Page 9 and 10:
Bridging the Rivers ofChange Togeth
- Page 11 and 12:
Bridging the Rivers ofChange Togeth
- Page 13 and 14:
Bridging the Rivers ofChange Togeth
- Page 15 and 16:
Bridging the Rivers ofChange Togeth
- Page 17 and 18:
Bridging the Rivers ofChange Togeth
- Page 19 and 20:
Bridging the Rivers ofChange Togeth
- Page 21 and 22:
Bridging the Rivers ofChange Togeth
- Page 23 and 24:
Bridging the Rivers ofChange Togeth
- Page 25 and 26:
Bridging the Rivers ofChange Togeth
- Page 27 and 28:
Bridging the Rivers ofChange Togeth
- Page 29 and 30:
Bridging the Rivers ofChange Togeth
- Page 31 and 32:
Bridging the Rivers ofChange Togeth
- Page 33 and 34:
Bridging the Rivers ofChange Togeth
- Page 35 and 36:
Bridging the Rivers ofChange Togeth
- Page 37 and 38:
Bridging the Rivers ofChange Togeth
- Page 39 and 40:
Bridging the Rivers ofChange Togeth
- Page 41 and 42:
Bridging the Rivers ofChange Togeth
- Page 43 and 44:
Bridging the Rivers ofChange Togeth
- Page 45 and 46:
Bridging the Rivers ofChange Togeth
- Page 47 and 48:
Bridging the Rivers ofChange Togeth
- Page 49 and 50:
Bridging the Rivers ofChange Togeth
- Page 51 and 52:
Bridging the Rivers ofChange Togeth
- Page 53 and 54:
Bridging the Rivers ofChange Togeth
- Page 55 and 56:
Bridging the Rivers ofChange Togeth
- Page 57 and 58:
Bridging the Rivers ofChange Togeth
- Page 59 and 60:
Bridging the Rivers ofChange Togeth
- Page 61 and 62:
Bridging the Rivers ofChange Togeth
- Page 63 and 64:
Bridging the Rivers ofChange Togeth
- Page 65 and 66:
Bridging the Rivers ofChange Togeth
- Page 67 and 68:
Bridging the Rivers ofChange Togeth
- Page 69 and 70:
Bridging the Rivers ofChange Togeth
- Page 71 and 72:
Bridging the Rivers ofChange Togeth
- Page 73 and 74:
Bridging the Rivers ofChange Togeth
- Page 75 and 76:
Bridging the Rivers ofChange Togeth
- Page 77 and 78:
Bridging the Rivers ofChange Togeth
- Page 79 and 80:
Bridging the Rivers ofChange Togeth
- Page 81 and 82:
Bridging the Rivers ofChange Togeth
- Page 83 and 84:
Bridging the Rivers ofChange Togeth
- Page 85 and 86:
Bridging the Rivers ofChange Togeth
- Page 87 and 88:
Bridging the Rivers ofChange Togeth
- Page 89 and 90:
Bridging the Rivers ofChange Togeth
- Page 91 and 92:
Bridging the Rivers ofChange Togeth
- Page 93 and 94:
Bridging the Rivers ofChange Togeth
- Page 95 and 96:
Bridging the Rivers ofChange Togeth
- Page 97 and 98:
Bridging the Rivers ofChange Togeth
- Page 99 and 100:
Bridging the Rivers ofChange Togeth
- Page 101 and 102:
Bridging the Rivers ofChange Togeth
- Page 103 and 104:
Bridging the Rivers ofChange Togeth
- Page 105 and 106:
Bridging the Rivers ofChange Togeth
- Page 107 and 108:
Bridging the Rivers ofChange Togeth
- Page 109 and 110:
Bridging the Rivers ofChange Togeth
- Page 111 and 112:
Bridging the Rivers ofChange Togeth
- Page 113 and 114:
Bridging the Rivers ofChange Togeth
- Page 115 and 116:
Bridging the Rivers ofChange Togeth
- Page 117 and 118:
Bridging the Rivers ofChange Togeth
- Page 119 and 120:
Bridging the Rivers ofChange Togeth
- Page 121 and 122:
Bridging the Rivers ofChange Togeth
- Page 123 and 124:
Bridging the Rivers ofChange Togeth
- Page 125 and 126:
Bridging the Rivers ofChange Togeth
- Page 127 and 128:
Bridging the Rivers ofChange Togeth
- Page 129 and 130:
Bridging the Rivers ofChange Togeth
- Page 131 and 132:
Bridging the Rivers ofChange Togeth
- Page 133 and 134:
Bridging the Rivers ofChange Togeth
- Page 135 and 136:
Bridging the Rivers ofChange Togeth
- Page 137 and 138:
Bridging the Rivers ofChange Togeth
- Page 139 and 140:
Bridging the Rivers ofChange Togeth
- Page 141 and 142:
Bridging the Rivers ofChange Togeth
- Page 143 and 144:
Bridging the Rivers ofChange Togeth
- Page 145 and 146:
Bridging the Rivers ofChange Togeth
- Page 147 and 148:
Bridging the Rivers ofChange Togeth
- Page 149 and 150:
Bridging the Rivers ofChange Togeth
- Page 151 and 152:
Bridging the Rivers ofChange Togeth
- Page 153 and 154:
Bridging the Rivers ofChange Togeth
- Page 155 and 156:
Bridging the Rivers ofChange Togeth
- Page 157 and 158:
Bridging the Rivers ofChange Togeth
- Page 159 and 160:
Bridging the Rivers ofChange Togeth
- Page 161 and 162:
Bridging the Rivers ofChange Togeth
- Page 163 and 164:
Bridging the Rivers ofChange Togeth
- Page 165 and 166:
Bridging the Rivers ofChange Togeth
- Page 167 and 168:
Bridging the Rivers ofChange Togeth
- Page 169 and 170:
Bridging the Rivers ofChange Togeth
- Page 171 and 172:
Bridging the Rivers ofChange Togeth
- Page 173 and 174:
Bridging the Rivers ofChange Togeth
- Page 175 and 176:
Bridging the Rivers ofChange Togeth
- Page 177 and 178:
Bridging the Rivers ofChange Togeth
- Page 179 and 180:
Bridging the Rivers ofChange Togeth
- Page 181 and 182:
Bridging the Rivers ofChange Togeth
- Page 183 and 184:
Bridging the Rivers ofChange Togeth
- Page 185 and 186:
Bridging the Rivers ofChange Togeth
- Page 187 and 188:
Bridging the Rivers ofChange Togeth
- Page 189 and 190:
Bridging the Rivers ofChange Togeth
- Page 191 and 192:
Bridging the Rivers ofChange Togeth
- Page 193 and 194:
Bridging the Rivers ofChange Togeth
- Page 195 and 196:
Bridging the Rivers ofChange Togeth
- Page 197 and 198:
Bridging the Rivers ofChange Togeth
- Page 199 and 200:
Bridging the Rivers ofChange Togeth
- Page 201 and 202:
Bridging the Rivers ofChange Togeth
- Page 203 and 204:
Bridging the Rivers ofChange Togeth
- Page 205 and 206:
Bridging the Rivers ofChange Togeth
- Page 207 and 208:
Bridging the Rivers ofChange Togeth
- Page 209 and 210:
Bridging the Rivers ofChange Togeth
- Page 211 and 212:
Bridging the Rivers ofChange Togeth
- Page 213 and 214:
Bridging the Rivers ofChange Togeth
- Page 215 and 216:
Bridging the Rivers ofChange Togeth
- Page 217 and 218:
Bridging the Rivers ofChange Togeth
- Page 219 and 220:
Bridging the Rivers ofChange Togeth
- Page 221 and 222:
Bridging the Rivers ofChange Togeth
- Page 223 and 224:
Bridging the Rivers ofChange Togeth
- Page 225 and 226:
Bridging the Rivers ofChange Togeth
- Page 227 and 228:
Bridging the Rivers ofChange Togeth
- Page 229 and 230:
Bridging the Rivers ofChange Togeth
- Page 231 and 232:
Bridging the Rivers ofChange Togeth
- Page 233 and 234:
Bridging the Rivers ofChange Togeth
- Page 235 and 236:
Bridging the Rivers ofChange Togeth
- Page 237 and 238:
Bridging the Rivers ofChange Togeth
- Page 239 and 240:
Bridging the Rivers ofChange Togeth
- Page 241 and 242:
Bridging the Rivers ofChange Togeth
- Page 243 and 244:
Bridging the Rivers ofChange Togeth
- Page 245 and 246:
Bridging the Rivers ofChange Togeth
- Page 247 and 248:
Bridging the Rivers ofChange Togeth
- Page 249 and 250:
Bridging the Rivers ofChange Togeth
- Page 265:
Bridging the Rivers ofChange Togeth
- Page 272 and 273:
Bridging the Rivers ofChange Togeth
- Page 274 and 275:
Bridging the Rivers ofChange Togeth
- Page 276 and 277:
Bridging the Rivers ofChange Togeth
- Page 278 and 279:
Bridging the Rivers ofChange Togeth
- Page 280 and 281:
Bridging the Rivers ofChange Togeth
- Page 282 and 283:
Bridging the Rivers ofChange Togeth
- Page 284 and 285:
Bridging the Rivers ofChange Togeth
- Page 286 and 287:
Bridging the Rivers ofChange Togeth
- Page 288 and 289:
Bridging the Rivers ofChange Togeth
- Page 290 and 291:
Bridging the Rivers ofChange Togeth
- Page 292 and 293:
Bridging the Rivers ofChange Togeth
- Page 294 and 295:
Bridging the Rivers ofChange Togeth
- Page 296 and 297:
Bridging the Rivers ofChange Togeth
- Page 298 and 299:
Bridging the Rivers ofChange Togeth
- Page 300 and 301:
Bridging the Rivers ofChange Togeth
- Page 302 and 303:
Bridging the Rivers ofChange Togeth
- Page 304 and 305:
Bridging the Rivers ofChange Togeth
- Page 306 and 307:
Bridging the Rivers ofChange Togeth
- Page 308 and 309:
Bridging the Rivers ofChange Togeth
- Page 310 and 311:
Bridging the Rivers ofChange Togeth
- Page 312 and 313:
Bridging the Rivers ofChange Togeth
- Page 314 and 315:
Bridging the Rivers ofChange Togeth
- Page 316 and 317:
Bridging the Rivers ofChange Togeth
- Page 318 and 319:
Bridging the Rivers ofChange Togeth
- Page 320 and 321:
Bridging the Rivers ofChange Togeth
- Page 322 and 323:
Bridging the Rivers ofChange Togeth
- Page 324 and 325:
Bridging the Rivers ofChange Togeth
- Page 326 and 327:
Bridging the Rivers ofChange Togeth
- Page 328 and 329:
Bridging the Rivers ofChange Togeth
- Page 330 and 331:
Bridging the Rivers ofChange Togeth
- Page 332 and 333:
Bridging the Rivers ofChange Togeth
- Page 334 and 335:
Bridging the Rivers ofChange Togeth
- Page 336 and 337:
e10vkTable of ContentsItem 1:Overvi
- Page 338 and 339:
e10vkDepartment of Health Services
- Page 340 and 341:
e10vkservices, and reputation or na
- Page 342 and 343:
e10vkIf our government contracts ar
- Page 344 and 345:
e10vkIf our cost increases resultin
- Page 346 and 347:
e10vkour board of directors. Becaus
- Page 348 and 349:
e10vkFirst Quarter $ 44.94 $ 23.46S
- Page 350 and 351:
e10vkTable of ContentsCertain compo
- Page 352 and 353:
e10vkNevada 8,037 1,106.45 9,099 1,
- Page 354 and 355:
e10vkInvestment IncomeInvestment in
- Page 356 and 357:
e10vkand 2007, respectively. EBITDA
- Page 358 and 359:
e10vk$2.8 million, or $0.10 per dil
- Page 360 and 361:
e10vkREPORT OF INDEPENDENT REGISTER
- Page 362 and 363:
e10vk65Table of ContentsMOLINA HEAL
- Page 364 and 365:
e10vkDelegated Provider InsolvencyC
- Page 366 and 367:
e10vk2007 (see Note 11, “Long-Ter
- Page 368 and 369:
e10vk$ 252,380 $ 248,039Gross reali
- Page 370 and 371:
e10vkTable of ContentsMOLINA HEALTH
- Page 372 and 373:
e10vk$10.9 million, and $7.9 millio
- Page 374 and 375:
e10vkIn July 2008, our board of dir
- Page 376 and 377:
e10vkThe Registrant has an equity i
- Page 378 and 379:
e10vkSIGNATURESPursuant to the requ
- Page 380 and 381:
exv12w1EX-12.1 2 a51362exv12w1.htm
- Page 382 and 383:
exv23w1EX-23.1 4 a51362exv23w1.htm
- Page 384 and 385:
exv31w2EX-31.2 6 a51362exv31w2.htm
- Page 386 and 387:
exv32w2EX-32.2 8 a51362exv32w2.htm
- Page 388 and 389:
e10vkEX-31.1EX-31.2EX-32.1EX-32.2Ta
- Page 390 and 391:
e10vkLeverage operational efficienc
- Page 392 and 393:
e10vkhealth plans. Among such facto
- Page 394 and 395:
e10vkMissouri and Ohio health plans
- Page 396 and 397:
e10vkWe are subject to various rout
- Page 398 and 399:
e10vkIt may be difficult for a thir
- Page 400 and 401:
e10vkItem 5:PART IIMarket for Regis
- Page 402 and 403:
e10vkstates to exclude certain bene
- Page 404 and 405:
e10vkMedical care ratio 86.8% 84.8%
- Page 406 and 407:
e10vkTable of ContentsMedical care
- Page 408 and 409:
e10vkare required to pay a fee for
- Page 410 and 411:
e10vkknown. While we believe our cu
- Page 412 and 413:
e10vkTable of ContentsMOLINA HEALTH
- Page 414 and 415:
e10vkYear Ended December 31,2009 20
- Page 416 and 417:
e10vkCalifornia $ 481,717 $ 417,027
- Page 418 and 419:
e10vkMOLINA HEALTHCARE, INC.NOTES T
- Page 420 and 421:
e10vk2008, we had transitioned fewe
- Page 422 and 423:
e10vknot intend to sell, nor is it
- Page 424 and 425:
e10vk87Table of ContentsMOLINA HEAL
- Page 426 and 427:
e10vkDuring 2009, 2008, and 2007, t
- Page 428 and 429:
e10vk$29.17 - $30.05 9,350 5.9 $ 29
- Page 430 and 431:
e10vk(1) The Registrant’s condens
- Page 432 and 433:
e10vkChanges in Internal Controls:
- Page 434 and 435:
e10vkSignature Title Date/s/ Joseph
- Page 436 and 437:
exv10w22Commitments exceed the sum
- Page 438 and 439:
exv10w22Loan Document. The amendmen
- Page 440 and 441:
exv10w22Name:Title:Fifth Amendment
- Page 442 and 443:
exv10w22Fifth Amendment to Credit A
- Page 444 and 445:
exv10w24EX-10.24 3 a55407exv10w24.h
- Page 446 and 447:
exv10w24Molina ECMS ref# 729 Provid
- Page 448 and 449:
exv10w24Molina ECMS ref# 729 Provid
- Page 450 and 451:
exv10w24HSA — Hospital Services A
- Page 452 and 453:
exv10w243.2 Member Eligibility Dete
- Page 454 and 455:
exv10w245.6 Amendment. Health Plan
- Page 456 and 457:
exv10w24HSA — Hospital Services A
- Page 458 and 459:
exv10w24License No. StreetNPI (or U
- Page 460 and 461:
exv10w24Page 23 of 40ATTACHMENT CPr
- Page 462 and 463:
exv10w24• This reimbursement meth
- Page 464 and 465: exv10w24Molina ECMS ref# 729 Provid
- Page 466 and 467: exv10w24(Rule 53250(e)(4))8. Provid
- Page 468 and 469: exv10w241. Right to Audit. Provider
- Page 470 and 471: exv10w24Treasurer G. William Hammer
- Page 472 and 473: exv10w25unless the situation is one
- Page 474 and 475: exv10w25Plan in identifying, proces
- Page 476 and 477: exv10w25Page 9that the offset and r
- Page 478 and 479: exv10w25under this Agreement.h. Hea
- Page 480 and 481: exv10w25Page 16Date 6/1/06ATTACHMEN
- Page 482 and 483: exv10w25that Provider is de-delegat
- Page 484 and 485: exv10w25the subscriber or Member by
- Page 486 and 487: exv10w25discretion, that Provider h
- Page 488 and 489: exv10w252.5 Annual Disclosure of Ca
- Page 490 and 491: exv10w25Initials of authorizedrepre
- Page 492 and 493: exv10w25the report is true and corr
- Page 494 and 495: exv21w1EX-21.1 6 a55407exv21w1.htm
- Page 496 and 497: exv31w1EX-31.1 8 a55407exv31w1.htm
- Page 498 and 499: exv32w1EX-32.1 10 a55407exv32w1.htm
- Page 500 and 501: e10vk10-K 1 a58840e10vk.htm FORM 10
- Page 502 and 503: e10vkOur StrengthsWe focus on servi
- Page 504 and 505: e10vkevent.CompetitionWe operate in
- Page 506 and 507: e10vkat the funding for these healt
- Page 508 and 509: e10vk18Table of ContentsAlso, many
- Page 510 and 511: e10vkTable of Contentsalleged non-c
- Page 512 and 513: e10vk(fair value of $20.4 million).
- Page 516 and 517: e10vkAs of December 31, 2010, our h
- Page 519 and 520: e10vkYear Ended December 31,2010 20
- Page 521 and 522: e10vkAcquisitionsWisconsin Health P
- Page 523 and 524: e10vkspecific performance measures
- Page 525 and 526: e10vkoverestimations were tied to o
- Page 527 and 528: e10vkIntangible assets, net 105,500
- Page 529 and 530: e10vkOur Health Plans segment compr
- Page 531 and 532: e10vkSituations may arise where the
- Page 533 and 534: e10vkinvestment fund. As of Decembe
- Page 535 and 536: e10vk87Table of ContentsMOLINA HEAL
- Page 537 and 538: e10vk7. ReceivablesHealth Plans seg
- Page 539 and 540: e10vkTable of ContentsMOLINA HEALTH
- Page 541 and 542: e10vkindebtedness under the Credit
- Page 543 and 544: e10vkstatutory capital and surplus
- Page 545 and 546: e10vkCash paid in business purchase
- Page 547 and 548: e10vkItem 12.Security Ownership of
- Page 549 and 550: exv10w27EX-10.27 2 a58840exv10w27.h
- Page 551 and 552: exv10w27(f) all transferable or ass
- Page 553 and 554: exv10w27and other charges have been
- Page 555 and 556: exv10w27under or affecting the Prop
- Page 557 and 558: exv10w27BY A GENERAL RELEASE, WHICH
- Page 559 and 560: exv10w27(f) Seller’s share of the
- Page 561 and 562: exv10w2710.6 Items Not to be Prorat
- Page 563 and 564: exv10w27- 21 -(i) Delinquency Repor
- Page 565 and 566:
exv10w27executed, and delivered by
- Page 567 and 568:
exv10w27MATERIALS THAT PERTAIN TO T
- Page 569 and 570:
exv10w27Attn: General CounselTeleph
- Page 571 and 572:
exv10w2718.16 Authority. The indivi
- Page 573 and 574:
exv12w1EX-12.1 3 a58840exv12w1.htm
- Page 575 and 576:
exv23w1EX-23.1 5 a58840exv23w1.htm
- Page 577 and 578:
exv31w2EX-31.2 7 a58840exv31w2.htm
- Page 579:
exv32w2EX-32.2 9 a58840exv32w2.htm