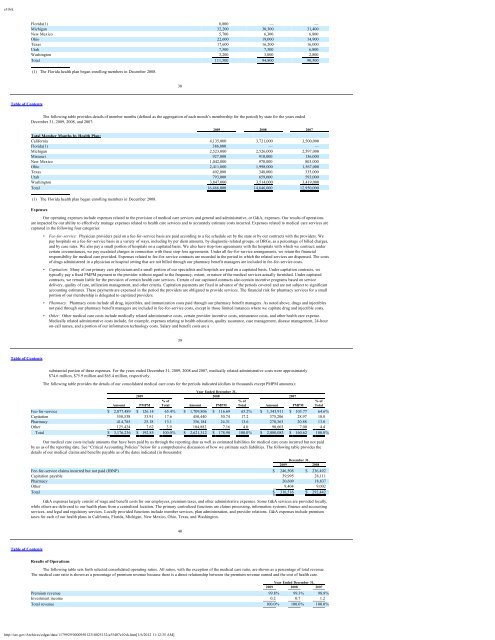
e10vkstates to exclude certain benefits from the managed care contract (most often pharmacy and catastrophic case benefits) and retain responsibility for those benefits at the statelevel. Medicare premiums are almost $1,200 PMPM, with Medicare revenue totaling $135.9 million, $95.1 million, and $49.3 million, for the years ended December 31, 2009,2008, and 2007, respectively.For the year ended December 31, 2009, we received approximately 5% of our premium revenue in the form of “birth income” — a one-time payment for the delivery ofa child — from the <strong>Medicaid</strong> programs in California (effective October 1, 2009), Michigan, Missouri, Ohio, Texas, Utah (effective September 1, 2009), and Washington. Suchpayments are recognized as revenue in the month the birth occurs. Approximately 2.5% of our premium revenue for the year ended December 31, 2009 was realized under a<strong>Medicaid</strong> cost-plus reimbursement agreement with the state of Utah that ended effective August 31, 2009. Effective September 1, 2009, the Utah health plan’s contract with thestate of Utah became a prepaid capitation contract, under which the plan is now paid a fixed PMPM amount, as in the other states in which we operate.Certain components of premium revenue are subject to accounting estimates. Chief among these are:• Florida Health Plan Medical Cost Floor (Minimum) for Behavioral Health. A portion of premium revenue paid to our Florida health plan by the state of Florida maybe refunded to the state if certain minimum amounts are not spent on defined behavioral health care costs. At December 31, 2009, we had not recorded any liabilityunder the terms of this contract provision. If the state of Florida disagrees with our interpretation of the existing contract terms, an adjustment to the amounts owedmay be required. Any changes to the terms of this provision, including revisions to the definitions of premium revenue or behavioral health care costs, the period oftime over which performance is measured or the manner of its measurement, or the percentages used in the calculations, may affect the profitability of our Floridahealth plan.• New Mexico Health Plan Medical Cost Floors (Minimums) and Administrative Cost and Profit Ceilings (Maximums): A portion of premium revenue paid to ourNew Mexico health plan by the state of New Mexico may be refunded to the state if certain minimum amounts are not spent on defined medical care costs, or ifadministrative costs or profit (as defined) exceed certain amounts. Our contract with the state of New Mexico requires that we spend a minimum percentage ofpremium revenue on certain explicitly defined medical care costs (the medical cost floor). Our contract is for a three-year period, and the medical cost floor is basedon premiums and medical care costs over the entire contract period. Effective July 1, 2008, our New Mexico health plan entered into a new three year contract that, inaddition to retaining the medical cost floor, added certain limits on the amount our New Mexico health plan can: (a) expend on administrative costs; and (b) retain asprofit. At December 31, 2009, we had not recorded any liability under the terms of these contract provisions. If the state of New Mexico disagrees with ourinterpretation of the existing contract terms, an adjustment to the amounts owed may be required. Any changes to the terms of these provisions, including revisions tothe definitions of premium revenue, medical care costs, administrative costs or profit, the period of time over which performance is measured or the manner of itsmeasurement, or the percentages used in the calculations, may affect the profitability of our New Mexico health plan.• New Mexico Health Plan At-Risk Premium Revenue: Under our contract with the state of New Mexico, up to 1% of our New Mexico health plan’s revenue may berefundable to the state if certain performance measures are not met. These performance measures are generally linked to various quality of care and administrativemeasures dictated by the state. Through December 31, 2009, our New Mexico health plan had received $3.6 million in at-risk revenue for state fiscal year 2009 andthe first half of state fiscal year 2010 combined. We have recognized $2.2 million of that amount as revenue through December 31, 2009, and recorded a liability ofapproximately $1.4 million for the remainder.• Ohio Health Plan At-Risk Premium Revenue: Under our contract with the state of Ohio, up to 1% of our Ohio health plan’s revenue may be refundable to the state ifcertain performance measures are not met. These performance measures are generally linked to various quality of care measures dictated by the state. ThroughDecember 31, 2009, our Ohio health plan had received $8.8 million in at-risk revenue for state fiscal year 200936Table of Contentsand the first half of state fiscal year 2010 combined. We have recognized $7.5 million of that amount as revenue through December 31, 2009 and recorded a liabilityof approximately $1.3 million for the remainder.• Utah Health Plan Premium Revenue: Our Utah health plan may be entitled to receive additional premium revenue from the state of Utah as an incentive payment forsaving the state of Utah money in relation to fee-for-service <strong>Medicaid</strong>. In prior years, we estimated amounts we believed were recoverable under our savings sharingagreement with the state of Utah based on available information and our interpretation of our contract with the state. The state may not agree with our interpretationor our application of the contract language, and it may also not agree with the manner in which we have processed and analyzed our member claims and encounterrecords. Thus, the ultimate amount of savings sharing revenue that we realize from prior years may be subject to negotiation with the state. During 2007, as a result ofan ongoing disagreement with the state of Utah, we wrote off the entire receivable, totaling $4.7 million. Our Utah health plan continues to assert its claim to theamounts believed to be due under the savings share agreement. When additional information is known, or resolution is reached with the state regarding theappropriate savings sharing payment amount for prior years, we will adjust the amount of savings sharing revenue recorded in our financial statements as appropriatein light of such new information or agreement. No receivables for saving sharing revenue have been established at December 31, 2009 and 2008.• Texas Health Plan Premium Revenue: The contract entered into between our Texas health plan and the state of Texas includes a profit-sharing agreement, where wepay a rebate to the state of Texas if our Texas health plan generates pretax income above a certain specified percentage, as determined in accordance with a tieredrebate schedule. We are limited in the amount of administrative costs that we may deduct in calculating the rebate, if any. As of December 31, 2009, we had anaggregate liability of approximately $2.0 million accrued pursuant to our profit-sharing agreement with the state of Texas for the 2009 and 2010 contract years(ending August 31 of each year). During 2009, we paid the state of Texas $4.9 million relating to the 2008 and 2009 contract years, and the 2008 contract year is nowclosed. Because the final settlement calculations include a claims run-out period of nearly one year, the amounts recorded, based on our estimates, may be adjusted.We believe that the ultimate settlement will not differ materially from our estimates.• Texas Health Plan At-Risk Premium Revenue: Under our contract with the state of Texas, up to 1% of our Texas health plan’s revenue may be refundable to the stateif certain performance measures are not met. These performance measures are generally linked to various quality of care measures dictated by the state. ThroughDecember 31, 2009, our Texas health plan had received $1.7 million in at-risk revenue for state fiscal year 2009 and the first half of state fiscal year 2010 combined.We have recognized $1.2 million of that amount as revenue through December 31, 2009, and recorded a liability of approximately $0.5 million for the remainder.• Medicare Premium Revenue: Based on member encounter data that we submit to CMS, our Medicare revenue is subject to retroactive adjustment for both memberrisk scores and member pharmacy cost experience for up to two years after the original year of service. This adjustment takes into account the acuity of eachmember’s medical needs relative to what was anticipated when premiums were originally set for that member. In the event that a member requires less acute medicalcare than was anticipated by the original premium amount, CMS may recover premium from us. In the event that a member requires more acute medical care thanwas anticipated by the original premium amount, CMS may pay us additional retroactive premium. A similar retroactive reconciliation is undertaken by CMS for ourMedicare members’ pharmacy utilization. That analysis is similar to the process for the adjustment of member risk scores, but is further complicated by memberpharmacy cost sharing provisions attached to the Medicare pharmacy benefit that do not apply to the services measured by the member risk adjustment process. Weestimate the amount of Medicare revenue that will ultimately be realized for the periods presented based on our knowledge of our members’ heath care utilizationpatterns and CMS practices. To the extent that the premium revenue ultimately received from CMS differs from recorded amounts, we will adjust reported Medicarerevenue. Based upon our knowledge of member health care utilization patterns we have recorded a liability of approximately $0.6 million related to the potentialrecoupment of Medicare premium revenue at December 31, 2009.37Table of ContentsHistorically, membership growth has been the primary reason for our increasing annual premium revenues, although more recently our revenues have also grown due tothe more care-intensive benefits and related higher premiums associated with our ABD and Medicare members. We have increased our membership through both internalgrowth and acquisitions. The following table sets forth the approximate total number of members by state health plan as of the dates indicated:As of December 31,2009 2008 2007Total Ending Membership by Health Plan:California 351,000 322,000 296,000Florida(1) 50,000 — —Michigan 223,000 206,000 209,000Missouri 78,000 77,000 68,000New Mexico 94,000 84,000 73,000Ohio 216,000 176,000 136,000Texas 40,000 31,000 29,000Utah 69,000 61,000 55,000Washington 334,000 299,000 283,000Total 1,455,000 1,256,000 1,149,000Total Ending Membership by State for our Medicare Advantage Special Needs Plans:California 2,100 1,500 1,100Michigan 3,300 1,700 1,100New Mexico 400 300 —Texas 500 400 —Utah 4,000 2,400 1,900Washington 1,300 1,000 500Total 11,600 7,300 4,600Total Ending Membership by State for our Aged, Blind or Disabled (“ABD”) Population:California 13,900 12,700 11,800http://sec.gov/Archives/edgar/data/1179929/000095012310025132/a55407e10vk.htm[1/6/2012 11:12:35 AM]
e10vkFlorida(1) 8,800 — —Michigan 32,200 30,300 31,400New Mexico 5,700 6,300 6,800Ohio 22,600 19,000 14,900Texas 17,600 16,200 16,000Utah 7,500 7,300 6,800Washington 3,200 3,000 2,800Total 111,500 94,800 90,500(1) The Florida health plan began enrolling members in December 2008.38Table of ContentsThe following table provides details of member months (defined as the aggregation of each month’s membership for the period) by state for the years endedDecember 31, 2009, 2008, and 2007:2009 2008 2007Total Member Months by Health Plan:California 4,135,000 3,721,000 3,500,000Florida(1) 386,000 — —Michigan 2,523,000 2,526,000 2,597,000Missouri 927,000 910,000 136,000New Mexico 1,042,000 970,000 803,000Ohio 2,411,000 1,998,000 1,567,000Texas 402,000 348,000 335,000Utah 793,000 659,000 593,000Washington 3,847,000 3,514,000 3,419,000Total 16,466,000 14,646,000 12,950,000(1) The Florida health plan began enrolling members in December 2008.ExpensesOur operating expenses include expenses related to the provision of medical care services and general and administrative, or G&A, expenses. Our results of operationsare impacted by our ability to effectively manage expenses related to health care services and to accurately estimate costs incurred. Expenses related to medical care services arecaptured in the following four categories:• Fee-for-service: Physician providers paid on a fee-for-service basis are paid according to a fee schedule set by the state or by our contracts with the providers. Wepay hospitals on a fee-for-service basis in a variety of ways, including by per diem amounts, by diagnostic-related groups, or DRGs, as a percentage of billed charges,and by case rates. We also pay a small portion of hospitals on a capitated basis. We also have stop-loss agreements with the hospitals with which we contract; undercertain circumstances, we pay escalated charges in connection with these stop-loss agreements. Under all fee-for-service arrangements, we retain the financialresponsibility for medical care provided. Expenses related to fee-for-service contracts are recorded in the period in which the related services are dispensed. The costsof drugs administered in a physician or hospital setting that are not billed through our pharmacy benefit managers are included in fee-for-service costs.• Capitation: Many of our primary care physicians and a small portion of our specialists and hospitals are paid on a capitated basis. Under capitation contracts, wetypically pay a fixed PMPM payment to the provider without regard to the frequency, extent, or nature of the medical services actually furnished. Under capitatedcontracts, we remain liable for the provision of certain health care services. Certain of our capitated contracts also contain incentive programs based on servicedelivery, quality of care, utilization management, and other criteria. Capitation payments are fixed in advance of the periods covered and are not subject to significantaccounting estimates. These payments are expensed in the period the providers are obligated to provide services. The financial risk for pharmacy services for a smallportion of our membership is delegated to capitated providers.• Pharmacy: Pharmacy costs include all drug, injectibles, and immunization costs paid through our pharmacy benefit managers. As noted above, drugs and injectiblesnot paid through our pharmacy benefit managers are included in fee-for-service costs, except in those limited instances where we capitate drug and injectible costs.• Other: Other medical care costs include medically related administrative costs, certain provider incentive costs, reinsurance costs, and other health care expense.Medically related administrative costs include, for example, expenses relating to health education, quality assurance, case management, disease management, 24-houron-call nurses, and a portion of our information technology costs. Salary and benefit costs are a39Table of Contentssubstantial portion of these expenses. For the years ended December 31, 2009, 2008 and 2007, medically related administrative costs were approximately$74.6 million, $75.9 million and $65.4 million, respectively.The following table provides the details of our consolidated medical care costs for the periods indicated (dollars in thousands except PMPM amounts):Year Ended December 31,2009 2008 2007% of % of % ofAmount PMPM Total Amount PMPM Total Amount PMPM TotalFee-for-service $ 2,077,489 $ 126.14 65.4% $ 1,709,806 $ 116.69 65.2% $ 1,343,911 $ 103.77 64.6%Capitation 558,538 33.91 17.6 450,440 30.74 17.2 375,206 28.97 18.0Pharmacy 414,785 25.18 13.1 356,184 24.31 13.6 270,363 20.88 13.0Other 125,424 7.62 3.9 104,882 7.16 4.0 90,603 7.00 4.4Total $ 3,176,236 $ 192.85 100.0% $ 2,621,312 $ 178.90 100.0% $ 2,080,083 $ 160.62 100.0%Our medical care costs include amounts that have been paid by us through the reporting date as well as estimated liabilities for medical care costs incurred but not paidby us as of the reporting date. See “Critical Accounting Policies” below for a comprehensive discussion of how we estimate such liabilities. The following table provides thedetails of our medical claims and benefits payable as of the dates indicated (in thousands):December 31,2009 2008Fee-for-service claims incurred but not paid (IBNP) $ 246,508 $ 236,492Capitation payable 39,995 28,111Pharmacy 20,609 18,837Other 9,404 9,002Total $ 316,516 $ 292,442G&A expenses largely consist of wage and benefit costs for our employees, premium taxes, and other administrative expenses. Some G&A services are provided locally,while others are delivered to our health plans from a centralized location. The primary centralized functions are claims processing, information systems, finance and accountingservices, and legal and regulatory services. Locally provided functions include member services, plan administration, and provider relations. G&A expenses include premiumtaxes for each of our health plans in California, Florida, Michigan, New Mexico, Ohio, Texas, and Washington.40Table of ContentsResults of OperationsThe following table sets forth selected consolidated operating ratios. All ratios, with the exception of the medical care ratio, are shown as a percentage of total revenue.The medical care ratio is shown as a percentage of premium revenue because there is a direct relationship between the premium revenue earned and the cost of health care.Year Ended December 31,2009 2008 2007Premium revenue 99.8% 99.3% 98.8%Investment income 0.2 0.7 1.2Total revenue 100.0% 100.0% 100.0%http://sec.gov/Archives/edgar/data/1179929/000095012310025132/a55407e10vk.htm[1/6/2012 11:12:35 AM]
- Page 1:
Molina Medicaid SolutionsResponse t
- Page 7 and 8:
Bridging the Rivers ofChange Togeth
- Page 9 and 10:
Bridging the Rivers ofChange Togeth
- Page 11 and 12:
Bridging the Rivers ofChange Togeth
- Page 13 and 14:
Bridging the Rivers ofChange Togeth
- Page 15 and 16:
Bridging the Rivers ofChange Togeth
- Page 17 and 18:
Bridging the Rivers ofChange Togeth
- Page 19 and 20:
Bridging the Rivers ofChange Togeth
- Page 21 and 22:
Bridging the Rivers ofChange Togeth
- Page 23 and 24:
Bridging the Rivers ofChange Togeth
- Page 25 and 26:
Bridging the Rivers ofChange Togeth
- Page 27 and 28:
Bridging the Rivers ofChange Togeth
- Page 29 and 30:
Bridging the Rivers ofChange Togeth
- Page 31 and 32:
Bridging the Rivers ofChange Togeth
- Page 33 and 34:
Bridging the Rivers ofChange Togeth
- Page 35 and 36:
Bridging the Rivers ofChange Togeth
- Page 37 and 38:
Bridging the Rivers ofChange Togeth
- Page 39 and 40:
Bridging the Rivers ofChange Togeth
- Page 41 and 42:
Bridging the Rivers ofChange Togeth
- Page 43 and 44:
Bridging the Rivers ofChange Togeth
- Page 45 and 46:
Bridging the Rivers ofChange Togeth
- Page 47 and 48:
Bridging the Rivers ofChange Togeth
- Page 49 and 50:
Bridging the Rivers ofChange Togeth
- Page 51 and 52:
Bridging the Rivers ofChange Togeth
- Page 53 and 54:
Bridging the Rivers ofChange Togeth
- Page 55 and 56:
Bridging the Rivers ofChange Togeth
- Page 57 and 58:
Bridging the Rivers ofChange Togeth
- Page 59 and 60:
Bridging the Rivers ofChange Togeth
- Page 61 and 62:
Bridging the Rivers ofChange Togeth
- Page 63 and 64:
Bridging the Rivers ofChange Togeth
- Page 65 and 66:
Bridging the Rivers ofChange Togeth
- Page 67 and 68:
Bridging the Rivers ofChange Togeth
- Page 69 and 70:
Bridging the Rivers ofChange Togeth
- Page 71 and 72:
Bridging the Rivers ofChange Togeth
- Page 73 and 74:
Bridging the Rivers ofChange Togeth
- Page 75 and 76:
Bridging the Rivers ofChange Togeth
- Page 77 and 78:
Bridging the Rivers ofChange Togeth
- Page 79 and 80:
Bridging the Rivers ofChange Togeth
- Page 81 and 82:
Bridging the Rivers ofChange Togeth
- Page 83 and 84:
Bridging the Rivers ofChange Togeth
- Page 85 and 86:
Bridging the Rivers ofChange Togeth
- Page 87 and 88:
Bridging the Rivers ofChange Togeth
- Page 89 and 90:
Bridging the Rivers ofChange Togeth
- Page 91 and 92:
Bridging the Rivers ofChange Togeth
- Page 93 and 94:
Bridging the Rivers ofChange Togeth
- Page 95 and 96:
Bridging the Rivers ofChange Togeth
- Page 97 and 98:
Bridging the Rivers ofChange Togeth
- Page 99 and 100:
Bridging the Rivers ofChange Togeth
- Page 101 and 102:
Bridging the Rivers ofChange Togeth
- Page 103 and 104:
Bridging the Rivers ofChange Togeth
- Page 105 and 106:
Bridging the Rivers ofChange Togeth
- Page 107 and 108:
Bridging the Rivers ofChange Togeth
- Page 109 and 110:
Bridging the Rivers ofChange Togeth
- Page 111 and 112:
Bridging the Rivers ofChange Togeth
- Page 113 and 114:
Bridging the Rivers ofChange Togeth
- Page 115 and 116:
Bridging the Rivers ofChange Togeth
- Page 117 and 118:
Bridging the Rivers ofChange Togeth
- Page 119 and 120:
Bridging the Rivers ofChange Togeth
- Page 121 and 122:
Bridging the Rivers ofChange Togeth
- Page 123 and 124:
Bridging the Rivers ofChange Togeth
- Page 125 and 126:
Bridging the Rivers ofChange Togeth
- Page 127 and 128:
Bridging the Rivers ofChange Togeth
- Page 129 and 130:
Bridging the Rivers ofChange Togeth
- Page 131 and 132:
Bridging the Rivers ofChange Togeth
- Page 133 and 134:
Bridging the Rivers ofChange Togeth
- Page 135 and 136:
Bridging the Rivers ofChange Togeth
- Page 137 and 138:
Bridging the Rivers ofChange Togeth
- Page 139 and 140:
Bridging the Rivers ofChange Togeth
- Page 141 and 142:
Bridging the Rivers ofChange Togeth
- Page 143 and 144:
Bridging the Rivers ofChange Togeth
- Page 145 and 146:
Bridging the Rivers ofChange Togeth
- Page 147 and 148:
Bridging the Rivers ofChange Togeth
- Page 149 and 150:
Bridging the Rivers ofChange Togeth
- Page 151 and 152:
Bridging the Rivers ofChange Togeth
- Page 153 and 154:
Bridging the Rivers ofChange Togeth
- Page 155 and 156:
Bridging the Rivers ofChange Togeth
- Page 157 and 158:
Bridging the Rivers ofChange Togeth
- Page 159 and 160:
Bridging the Rivers ofChange Togeth
- Page 161 and 162:
Bridging the Rivers ofChange Togeth
- Page 163 and 164:
Bridging the Rivers ofChange Togeth
- Page 165 and 166:
Bridging the Rivers ofChange Togeth
- Page 167 and 168:
Bridging the Rivers ofChange Togeth
- Page 169 and 170:
Bridging the Rivers ofChange Togeth
- Page 171 and 172:
Bridging the Rivers ofChange Togeth
- Page 173 and 174:
Bridging the Rivers ofChange Togeth
- Page 175 and 176:
Bridging the Rivers ofChange Togeth
- Page 177 and 178:
Bridging the Rivers ofChange Togeth
- Page 179 and 180:
Bridging the Rivers ofChange Togeth
- Page 181 and 182:
Bridging the Rivers ofChange Togeth
- Page 183 and 184:
Bridging the Rivers ofChange Togeth
- Page 185 and 186:
Bridging the Rivers ofChange Togeth
- Page 187 and 188:
Bridging the Rivers ofChange Togeth
- Page 189 and 190:
Bridging the Rivers ofChange Togeth
- Page 191 and 192:
Bridging the Rivers ofChange Togeth
- Page 193 and 194:
Bridging the Rivers ofChange Togeth
- Page 195 and 196:
Bridging the Rivers ofChange Togeth
- Page 197 and 198:
Bridging the Rivers ofChange Togeth
- Page 199 and 200:
Bridging the Rivers ofChange Togeth
- Page 201 and 202:
Bridging the Rivers ofChange Togeth
- Page 203 and 204:
Bridging the Rivers ofChange Togeth
- Page 205 and 206:
Bridging the Rivers ofChange Togeth
- Page 207 and 208:
Bridging the Rivers ofChange Togeth
- Page 209 and 210:
Bridging the Rivers ofChange Togeth
- Page 211 and 212:
Bridging the Rivers ofChange Togeth
- Page 213 and 214:
Bridging the Rivers ofChange Togeth
- Page 215 and 216:
Bridging the Rivers ofChange Togeth
- Page 217 and 218:
Bridging the Rivers ofChange Togeth
- Page 219 and 220:
Bridging the Rivers ofChange Togeth
- Page 221 and 222:
Bridging the Rivers ofChange Togeth
- Page 223 and 224:
Bridging the Rivers ofChange Togeth
- Page 225 and 226:
Bridging the Rivers ofChange Togeth
- Page 227 and 228:
Bridging the Rivers ofChange Togeth
- Page 229 and 230:
Bridging the Rivers ofChange Togeth
- Page 231 and 232:
Bridging the Rivers ofChange Togeth
- Page 233 and 234:
Bridging the Rivers ofChange Togeth
- Page 235 and 236:
Bridging the Rivers ofChange Togeth
- Page 237 and 238:
Bridging the Rivers ofChange Togeth
- Page 239 and 240:
Bridging the Rivers ofChange Togeth
- Page 241 and 242:
Bridging the Rivers ofChange Togeth
- Page 243 and 244:
Bridging the Rivers ofChange Togeth
- Page 245 and 246:
Bridging the Rivers ofChange Togeth
- Page 247 and 248:
Bridging the Rivers ofChange Togeth
- Page 249 and 250:
Bridging the Rivers ofChange Togeth
- Page 265:
Bridging the Rivers ofChange Togeth
- Page 272 and 273:
Bridging the Rivers ofChange Togeth
- Page 274 and 275:
Bridging the Rivers ofChange Togeth
- Page 276 and 277:
Bridging the Rivers ofChange Togeth
- Page 278 and 279:
Bridging the Rivers ofChange Togeth
- Page 280 and 281:
Bridging the Rivers ofChange Togeth
- Page 282 and 283:
Bridging the Rivers ofChange Togeth
- Page 284 and 285:
Bridging the Rivers ofChange Togeth
- Page 286 and 287:
Bridging the Rivers ofChange Togeth
- Page 288 and 289:
Bridging the Rivers ofChange Togeth
- Page 290 and 291:
Bridging the Rivers ofChange Togeth
- Page 292 and 293:
Bridging the Rivers ofChange Togeth
- Page 294 and 295:
Bridging the Rivers ofChange Togeth
- Page 296 and 297:
Bridging the Rivers ofChange Togeth
- Page 298 and 299:
Bridging the Rivers ofChange Togeth
- Page 300 and 301:
Bridging the Rivers ofChange Togeth
- Page 302 and 303:
Bridging the Rivers ofChange Togeth
- Page 304 and 305:
Bridging the Rivers ofChange Togeth
- Page 306 and 307:
Bridging the Rivers ofChange Togeth
- Page 308 and 309:
Bridging the Rivers ofChange Togeth
- Page 310 and 311:
Bridging the Rivers ofChange Togeth
- Page 312 and 313:
Bridging the Rivers ofChange Togeth
- Page 314 and 315:
Bridging the Rivers ofChange Togeth
- Page 316 and 317:
Bridging the Rivers ofChange Togeth
- Page 318 and 319:
Bridging the Rivers ofChange Togeth
- Page 320 and 321:
Bridging the Rivers ofChange Togeth
- Page 322 and 323:
Bridging the Rivers ofChange Togeth
- Page 324 and 325:
Bridging the Rivers ofChange Togeth
- Page 326 and 327:
Bridging the Rivers ofChange Togeth
- Page 328 and 329:
Bridging the Rivers ofChange Togeth
- Page 330 and 331:
Bridging the Rivers ofChange Togeth
- Page 332 and 333:
Bridging the Rivers ofChange Togeth
- Page 334 and 335:
Bridging the Rivers ofChange Togeth
- Page 336 and 337:
e10vkTable of ContentsItem 1:Overvi
- Page 338 and 339:
e10vkDepartment of Health Services
- Page 340 and 341:
e10vkservices, and reputation or na
- Page 342 and 343:
e10vkIf our government contracts ar
- Page 344 and 345:
e10vkIf our cost increases resultin
- Page 346 and 347:
e10vkour board of directors. Becaus
- Page 348 and 349:
e10vkFirst Quarter $ 44.94 $ 23.46S
- Page 350 and 351:
e10vkTable of ContentsCertain compo
- Page 352 and 353: e10vkNevada 8,037 1,106.45 9,099 1,
- Page 354 and 355: e10vkInvestment IncomeInvestment in
- Page 356 and 357: e10vkand 2007, respectively. EBITDA
- Page 358 and 359: e10vk$2.8 million, or $0.10 per dil
- Page 360 and 361: e10vkREPORT OF INDEPENDENT REGISTER
- Page 362 and 363: e10vk65Table of ContentsMOLINA HEAL
- Page 364 and 365: e10vkDelegated Provider InsolvencyC
- Page 366 and 367: e10vk2007 (see Note 11, “Long-Ter
- Page 368 and 369: e10vk$ 252,380 $ 248,039Gross reali
- Page 370 and 371: e10vkTable of ContentsMOLINA HEALTH
- Page 372 and 373: e10vk$10.9 million, and $7.9 millio
- Page 374 and 375: e10vkIn July 2008, our board of dir
- Page 376 and 377: e10vkThe Registrant has an equity i
- Page 378 and 379: e10vkSIGNATURESPursuant to the requ
- Page 380 and 381: exv12w1EX-12.1 2 a51362exv12w1.htm
- Page 382 and 383: exv23w1EX-23.1 4 a51362exv23w1.htm
- Page 384 and 385: exv31w2EX-31.2 6 a51362exv31w2.htm
- Page 386 and 387: exv32w2EX-32.2 8 a51362exv32w2.htm
- Page 388 and 389: e10vkEX-31.1EX-31.2EX-32.1EX-32.2Ta
- Page 390 and 391: e10vkLeverage operational efficienc
- Page 392 and 393: e10vkhealth plans. Among such facto
- Page 394 and 395: e10vkMissouri and Ohio health plans
- Page 396 and 397: e10vkWe are subject to various rout
- Page 398 and 399: e10vkIt may be difficult for a thir
- Page 400 and 401: e10vkItem 5:PART IIMarket for Regis
- Page 404 and 405: e10vkMedical care ratio 86.8% 84.8%
- Page 406 and 407: e10vkTable of ContentsMedical care
- Page 408 and 409: e10vkare required to pay a fee for
- Page 410 and 411: e10vkknown. While we believe our cu
- Page 412 and 413: e10vkTable of ContentsMOLINA HEALTH
- Page 414 and 415: e10vkYear Ended December 31,2009 20
- Page 416 and 417: e10vkCalifornia $ 481,717 $ 417,027
- Page 418 and 419: e10vkMOLINA HEALTHCARE, INC.NOTES T
- Page 420 and 421: e10vk2008, we had transitioned fewe
- Page 422 and 423: e10vknot intend to sell, nor is it
- Page 424 and 425: e10vk87Table of ContentsMOLINA HEAL
- Page 426 and 427: e10vkDuring 2009, 2008, and 2007, t
- Page 428 and 429: e10vk$29.17 - $30.05 9,350 5.9 $ 29
- Page 430 and 431: e10vk(1) The Registrant’s condens
- Page 432 and 433: e10vkChanges in Internal Controls:
- Page 434 and 435: e10vkSignature Title Date/s/ Joseph
- Page 436 and 437: exv10w22Commitments exceed the sum
- Page 438 and 439: exv10w22Loan Document. The amendmen
- Page 440 and 441: exv10w22Name:Title:Fifth Amendment
- Page 442 and 443: exv10w22Fifth Amendment to Credit A
- Page 444 and 445: exv10w24EX-10.24 3 a55407exv10w24.h
- Page 446 and 447: exv10w24Molina ECMS ref# 729 Provid
- Page 448 and 449: exv10w24Molina ECMS ref# 729 Provid
- Page 450 and 451: exv10w24HSA — Hospital Services A
- Page 452 and 453:
exv10w243.2 Member Eligibility Dete
- Page 454 and 455:
exv10w245.6 Amendment. Health Plan
- Page 456 and 457:
exv10w24HSA — Hospital Services A
- Page 458 and 459:
exv10w24License No. StreetNPI (or U
- Page 460 and 461:
exv10w24Page 23 of 40ATTACHMENT CPr
- Page 462 and 463:
exv10w24• This reimbursement meth
- Page 464 and 465:
exv10w24Molina ECMS ref# 729 Provid
- Page 466 and 467:
exv10w24(Rule 53250(e)(4))8. Provid
- Page 468 and 469:
exv10w241. Right to Audit. Provider
- Page 470 and 471:
exv10w24Treasurer G. William Hammer
- Page 472 and 473:
exv10w25unless the situation is one
- Page 474 and 475:
exv10w25Plan in identifying, proces
- Page 476 and 477:
exv10w25Page 9that the offset and r
- Page 478 and 479:
exv10w25under this Agreement.h. Hea
- Page 480 and 481:
exv10w25Page 16Date 6/1/06ATTACHMEN
- Page 482 and 483:
exv10w25that Provider is de-delegat
- Page 484 and 485:
exv10w25the subscriber or Member by
- Page 486 and 487:
exv10w25discretion, that Provider h
- Page 488 and 489:
exv10w252.5 Annual Disclosure of Ca
- Page 490 and 491:
exv10w25Initials of authorizedrepre
- Page 492 and 493:
exv10w25the report is true and corr
- Page 494 and 495:
exv21w1EX-21.1 6 a55407exv21w1.htm
- Page 496 and 497:
exv31w1EX-31.1 8 a55407exv31w1.htm
- Page 498 and 499:
exv32w1EX-32.1 10 a55407exv32w1.htm
- Page 500 and 501:
e10vk10-K 1 a58840e10vk.htm FORM 10
- Page 502 and 503:
e10vkOur StrengthsWe focus on servi
- Page 504 and 505:
e10vkevent.CompetitionWe operate in
- Page 506 and 507:
e10vkat the funding for these healt
- Page 508 and 509:
e10vk18Table of ContentsAlso, many
- Page 510 and 511:
e10vkTable of Contentsalleged non-c
- Page 512 and 513:
e10vk(fair value of $20.4 million).
- Page 514 and 515:
e10vkTable of ContentsSTOCK PERFORM
- Page 516 and 517:
e10vkAs of December 31, 2010, our h
- Page 519 and 520:
e10vkYear Ended December 31,2010 20
- Page 521 and 522:
e10vkAcquisitionsWisconsin Health P
- Page 523 and 524:
e10vkspecific performance measures
- Page 525 and 526:
e10vkoverestimations were tied to o
- Page 527 and 528:
e10vkIntangible assets, net 105,500
- Page 529 and 530:
e10vkOur Health Plans segment compr
- Page 531 and 532:
e10vkSituations may arise where the
- Page 533 and 534:
e10vkinvestment fund. As of Decembe
- Page 535 and 536:
e10vk87Table of ContentsMOLINA HEAL
- Page 537 and 538:
e10vk7. ReceivablesHealth Plans seg
- Page 539 and 540:
e10vkTable of ContentsMOLINA HEALTH
- Page 541 and 542:
e10vkindebtedness under the Credit
- Page 543 and 544:
e10vkstatutory capital and surplus
- Page 545 and 546:
e10vkCash paid in business purchase
- Page 547 and 548:
e10vkItem 12.Security Ownership of
- Page 549 and 550:
exv10w27EX-10.27 2 a58840exv10w27.h
- Page 551 and 552:
exv10w27(f) all transferable or ass
- Page 553 and 554:
exv10w27and other charges have been
- Page 555 and 556:
exv10w27under or affecting the Prop
- Page 557 and 558:
exv10w27BY A GENERAL RELEASE, WHICH
- Page 559 and 560:
exv10w27(f) Seller’s share of the
- Page 561 and 562:
exv10w2710.6 Items Not to be Prorat
- Page 563 and 564:
exv10w27- 21 -(i) Delinquency Repor
- Page 565 and 566:
exv10w27executed, and delivered by
- Page 567 and 568:
exv10w27MATERIALS THAT PERTAIN TO T
- Page 569 and 570:
exv10w27Attn: General CounselTeleph
- Page 571 and 572:
exv10w2718.16 Authority. The indivi
- Page 573 and 574:
exv12w1EX-12.1 3 a58840exv12w1.htm
- Page 575 and 576:
exv23w1EX-23.1 5 a58840exv23w1.htm
- Page 577 and 578:
exv31w2EX-31.2 7 a58840exv31w2.htm
- Page 579:
exv32w2EX-32.2 9 a58840exv32w2.htm