- Page 1 and 2:
LIPPO-MAPLETREEINDONESIA RETAIL TRU
- Page 3 and 4:
Metropolis Town SquareMall WTC Mata
- Page 5 and 6:
KeyInvestmentHighlightsStrong acqui
- Page 7 and 8:
Locked-in master leases with rental
- Page 9 and 10:
1. Mall WTC Matahari UnitsRetail Sp
- Page 11 and 12:
Notice to investorsNo person is aut
- Page 13 and 14:
Forward-looking statementsCertain s
- Page 15 and 16:
Market and industry informationThis
- Page 17 and 18:
SummaryThe following summary is qua
- Page 19 and 20:
a right of first refusal (the “RO
- Page 21 and 22:
• The management of all the Retai
- Page 23 and 24:
information was extracted are based
- Page 25 and 26:
2006. It is estimated that the urba
- Page 27 and 28:
Further, the Retail Malls are manag
- Page 29 and 30:
Key Information on the PropertiesA
- Page 31 and 32:
Location of the Properties in Indon
- Page 33 and 34:
INFORMATION ON THE PROPERTIESThe Re
- Page 35 and 36:
Pictures of Gajah Mada Plaza19
- Page 37 and 38:
Percentage of contribution to LMIRT
- Page 39 and 40:
Number of tenants as at 30 June2007
- Page 41 and 42:
Car parking lots . . . . . . . . .
- Page 43 and 44:
Occupancy rate as at 30 June 2007.
- Page 45 and 46:
Year of building completion . . . .
- Page 47 and 48:
NLA as at 30 June 2007 . . . . . .
- Page 49 and 50:
Year of building completion . . . .
- Page 51 and 52:
Appraised value by Knight Frank as
- Page 53 and 54:
NPI for Forecast Period 2007,Projec
- Page 55 and 56:
Note:(1) Based on Strata Titles Own
- Page 57 and 58:
Note:(1) Based on Kiosks Sale and P
- Page 59 and 60:
Appraised value by Colliers as at30
- Page 61 and 62:
Percentage of contribution to LMIRT
- Page 63 and 64:
Notes:(1) These 14 Singapore SPCs (
- Page 65 and 66:
(See “Strategy—Capital and Risk
- Page 67 and 68:
Operating Companies: PT Multi Nusan
- Page 69 and 70:
Payable by LMIR Trust(c) Any other
- Page 71 and 72:
The offeringLMIR Trust . . . . . .
- Page 73 and 74:
Lock-ups . . . . . . . . . . . . .
- Page 75 and 76:
Listing and Trading . . . . . . . .
- Page 77 and 78:
Singapore are made in accordance wi
- Page 79 and 80:
Forecast Period2007Projection Year2
- Page 81 and 82:
Risk factorsProspective investors s
- Page 83 and 84:
Risk factorssimilar tenancy terms.
- Page 85 and 86:
Risk factors• losses arising from
- Page 87 and 88:
Risk factorsacquisitions is limited
- Page 89 and 90:
Risk factorsafter the proposed plan
- Page 91 and 92:
Risk factorsIf the tenure of the un
- Page 93 and 94:
Risk factorsThe Properties may be s
- Page 95 and 96:
Risk factorsRenovation work or phys
- Page 97 and 98:
Risk factorsSuch compulsory acquisi
- Page 99 and 100:
Risk factorsthereby materially and
- Page 101 and 102:
Risk factorsinterpretation by the I
- Page 103 and 104:
Risk factors• broad market fluctu
- Page 105 and 106:
Ownership of UnitsPRINCIPAL UNITHOL
- Page 107 and 108:
DistributionsThe distributable inco
- Page 109 and 110:
Exchange rates and exchange control
- Page 111 and 112:
CapitalisationThe following table s
- Page 113 and 114:
Unaudited pro forma consolidated ba
- Page 115 and 116:
Profit forecast and profit projecti
- Page 117 and 118:
Profit forecast and profit projecti
- Page 119 and 120:
Profit forecast and profit projecti
- Page 121 and 122:
Profit forecast and profit projecti
- Page 123 and 124:
Profit forecast and profit projecti
- Page 125 and 126:
Profit forecast and profit projecti
- Page 127 and 128:
Profit forecast and profit projecti
- Page 129 and 130:
StrategyDate, to the extent that LM
- Page 131 and 132:
StrategyGiven that there is limited
- Page 133 and 134:
Strategyterm funding in a more cost
- Page 135 and 136:
Business and propertiesIn addition,
- Page 137 and 138:
Business and propertiestheir daily
- Page 139 and 140:
Business and propertiesValuationEac
- Page 141 and 142:
Business and propertiesThe followin
- Page 143 and 144:
Business and propertiesINFORMATION
- Page 145 and 146:
Business and propertiesother strata
- Page 147 and 148:
Business and propertiesBecause of t
- Page 149 and 150:
Business and propertieswell-known c
- Page 151 and 152:
Business and propertiesThe largest
- Page 153 and 154:
Business and properties“Overview
- Page 155 and 156:
Business and properties200 sq m and
- Page 157 and 158:
Business and properties• Mal Cima
- Page 159 and 160:
Business and propertiesTHE PLAZA SE
- Page 161 and 162:
Business and propertiesThe table be
- Page 163 and 164:
Business and properties• Epicentr
- Page 165 and 166:
Business and propertiesMAL LIPPO CI
- Page 167 and 168:
Business and propertiesThe table be
- Page 169 and 170:
Business and propertiesPercentage o
- Page 171 and 172:
Business and propertiesfloor. The o
- Page 173 and 174:
Business and properties• Pangrang
- Page 175 and 176:
Business and propertiesBANDUNG INDA
- Page 177 and 178:
Business and propertiesThe table be
- Page 179 and 180:
Business and propertiesAmendment to
- Page 181 and 182:
Business and propertiesISTANA PLAZA
- Page 183 and 184:
Business and propertiesThe table be
- Page 185 and 186:
Business and propertiesThe Istana P
- Page 187 and 188:
Business and propertiesRelevant inf
- Page 189 and 190:
Business and propertiesRelevant inf
- Page 191 and 192:
Business and propertiesRelevant inf
- Page 193 and 194:
Business and propertiesAppraised va
- Page 195 and 196:
Business and propertiesRelevant inf
- Page 197 and 198:
Business and propertiesRelevant inf
- Page 199 and 200:
Business and propertiesRelevant inf
- Page 201 and 202:
Business and propertiesDescriptionP
- Page 203 and 204:
Business and propertiesSun PlazaMed
- Page 205 and 206:
The Manager and corporate governanc
- Page 207 and 208:
The Manager and corporate governanc
- Page 209 and 210:
The Manager and corporate governanc
- Page 211 and 212:
The Manager and corporate governanc
- Page 213 and 214:
The Manager and corporate governanc
- Page 215 and 216:
The Manager and corporate governanc
- Page 217 and 218:
The Manager and corporate governanc
- Page 219 and 220:
The Manager and corporate governanc
- Page 221 and 222:
The Manager and corporate governanc
- Page 223 and 224:
The Manager and corporate governanc
- Page 225 and 226:
The SponsorThe business structure o
- Page 227 and 228:
The Sponsorshopping, entertainment
- Page 229 and 230:
The SponsorKEY SHAREHOLDERS OF THE
- Page 231 and 232:
The formation and structure of LMIR
- Page 233 and 234:
The formation and structure of LMIR
- Page 235 and 236:
The formation and structure of LMIR
- Page 237 and 238:
The formation and structure of LMIR
- Page 239 and 240:
Certain agreements relating to LMIR
- Page 241 and 242:
Certain agreements relating to LMIR
- Page 243 and 244:
Certain agreements relating to LMIR
- Page 245 and 246:
Certain agreements relating to LMIR
- Page 247 and 248:
Certain agreements relating to LMIR
- Page 249 and 250:
Certain agreements relating to LMIR
- Page 251 and 252:
Certain agreements relating to LMIR
- Page 253 and 254:
Certain agreements relating to LMIR
- Page 255 and 256:
Certain agreements relating to LMIR
- Page 257 and 258:
Overview of relevant laws and regul
- Page 259 and 260:
Overview of relevant laws and regul
- Page 261 and 262:
Overview of relevant laws and regul
- Page 263 and 264:
Overview of relevant laws and regul
- Page 265 and 266:
TaxationSINGAPORE TAX IMPLICATIONST
- Page 267 and 268:
Taxationbe applied to reduce the co
- Page 269 and 270:
TaxationOn the rental payments to t
- Page 271 and 272:
Plan of distributionThe Manager is
- Page 273 and 274:
Plan of distributionThe restriction
- Page 275 and 276:
Plan of distributionNote:(1) Includ
- Page 277 and 278:
Plan of distributionArticle 31, sec
- Page 279 and 280:
Plan of distributionUnited States o
- Page 281 and 282:
Clearance and settlementINTRODUCTIO
- Page 283 and 284:
General information(1) The profit f
- Page 285 and 286:
General information(f)(g)(h)Rule 74
- Page 287 and 288:
Glossary% Per centum or percentageA
- Page 289 and 290:
GlossaryColliersColliers Internatio
- Page 291 and 292:
GlossaryIndonesian SPCsInterested P
- Page 293 and 294:
GlossaryNPIOCBC BankNet property in
- Page 295 and 296:
GlossaryRetail Space Singapore SPCs
- Page 297 and 298:
GlossaryUnit Lending AgreementUnit
- Page 299 and 300:
Appendix AINDEPENDENT ACCOUNTANTS
- Page 301 and 302:
Appendix BINDEPENDENT ACCOUNTANTS
- Page 303 and 304:
Appendix BLIPPO-MAPLETREE INDONESIA
- Page 305 and 306:
Appendix BPro Forma Consolidated Ba
- Page 307 and 308:
Appendix B(D)Pro Forma Consolidated
- Page 309 and 310:
Appendix B(x)(xi)(xii)(xiii)(xiv)S$
- Page 311 and 312:
Appendix BCash and cash equivalents
- Page 313 and 314:
Appendix BLeased assets—Leases in
- Page 315 and 316:
Appendix Btemporary difference; and
- Page 317 and 318:
Appendix B• The Trustee, the Mana
- Page 319 and 320:
Appendix BDeferred income represent
- Page 321 and 322:
Appendix Bfinancial year exceeds th
- Page 323 and 324:
Appendix Bprice is to be negotiated
- Page 325 and 326:
Appendix B4. Bandung Indah PlazaPT
- Page 327 and 328:
Appendix CINDEPENDENT SINGAPORE TAX
- Page 329 and 330:
Appendix CGains on disposal of shar
- Page 331 and 332:
Appendix CDisposal of UnitsSingapor
- Page 333 and 334:
Appendix DINDEPENDENT INDONESIAN TA
- Page 335 and 336:
Appendix DD-3
- Page 337 and 338:
Appendix DD-5
- Page 339 and 340:
Appendix DD-7
- Page 341 and 342:
Appendix EINDEPENDENT PROPERTY VALU
- Page 343 and 344:
Appendix EReport No.017/WPA-Report/
- Page 345 and 346:
Appendix EReport No.017/WPA-Report/
- Page 347 and 348:
Appendix EReport No.017/WPA-Report/
- Page 349 and 350:
Appendix EReport No.017/WPA-Report/
- Page 351 and 352:
Appendix EReport No.017/WPA-Report/
- Page 353 and 354:
Appendix EReport No.017/WPA-Report/
- Page 355 and 356:
Appendix EReport No.017/WPA-Report/
- Page 357 and 358:
Appendix EReport No.017/WPA-Report/
- Page 359 and 360:
Appendix EReport No.017/WPA-Report/
- Page 361 and 362:
Appendix EReport No.017/WPA-Report/
- Page 363 and 364:
Appendix EReport No.017/WPA-Report/
- Page 365 and 366: Appendix EReport No.017/WPA-Report/
- Page 367 and 368: Appendix EReport No.017/WPA-Report/
- Page 369 and 370: Appendix EReport No.017/WPA-Report/
- Page 371 and 372: Appendix EReport No.017/WPA-Report/
- Page 373 and 374: Appendix EReport No.017/WPA-Report/
- Page 375 and 376: Appendix EReport No.017/WPA-Report/
- Page 377 and 378: Appendix ERef. No: V/2006/PKG/3819
- Page 379 and 380: Appendix EVALUATION CERTIFICATEProp
- Page 381 and 382: Appendix EVALUATION CERTIFICATEProp
- Page 383 and 384: Appendix EVALUATION CERTIFICATEProp
- Page 385 and 386: Appendix EVALUATION CERTIFICATEProp
- Page 387 and 388: Appendix EVALUATION CERTIFICATEProp
- Page 389 and 390: Appendix EVALUATION CERTIFICATEProp
- Page 391 and 392: Appendix EVALUATION CERTIFICATEProp
- Page 393 and 394: Appendix EVALUATION CERTIFICATEProp
- Page 395 and 396: Appendix EVALUATION CERTIFICATEProp
- Page 397 and 398: Appendix EVALUATION CERTIFICATEProp
- Page 399 and 400: Appendix EPropertiesLandarea (m 2 )
- Page 401 and 402: Appendix EADDENDUM—STATEMENT OF A
- Page 403 and 404: Appendix FINDEPENDENT REPORT ON THE
- Page 405 and 406: TABLE OF CONTENTSREPORT INSTRUCTION
- Page 407 and 408: Report instructionsAbout Jones Lang
- Page 409 and 410: Executive summaryIMPLICATIONS FOR R
- Page 411 and 412: Overview of Indonesia and its Econo
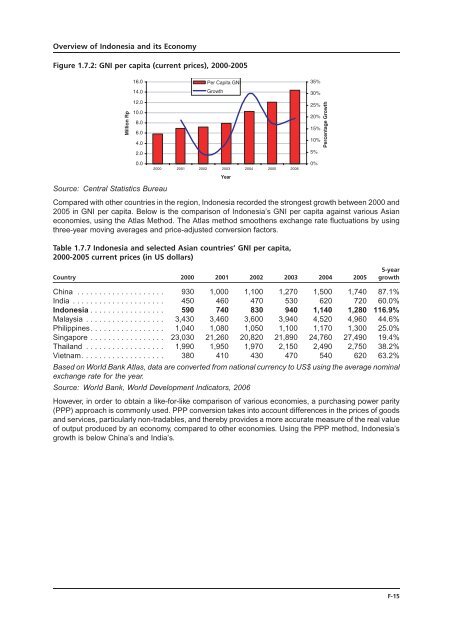
- Page 413 and 414: Overview of Indonesia and its Econo
- Page 415: Overview of Indonesia and its Econo
- Page 419 and 420: Overview of Indonesia and its Econo
- Page 421 and 422: Overview of Indonesia and its Econo
- Page 423 and 424: Overview of Indonesia and its Econo
- Page 425 and 426: Retail Market OverviewTable 2.1.1 I
- Page 427 and 428: Retail Market Overview2.3 Changing
- Page 429 and 430: Retail Market Overviewretailers hav
- Page 431 and 432: Retail Market OverviewCompletionyea
- Page 433 and 434: Retail Market Overview2.7.5 Carrefo
- Page 435 and 436: Retail Market OverviewIn view of th
- Page 437 and 438: Overview of PortfolioAs the adminis
- Page 439 and 440: Overview of PortfolioFigure 3.1.4:
- Page 441 and 442: Overview of PortfolioFigure 3.2.2 B
- Page 443 and 444: Overview of PortfolioFigure 3.2.4 S
- Page 445 and 446: Overview of PortfolioFigure 3.2.6 M
- Page 447 and 448: Overview of PortfolioFigure 3.3.1 L
- Page 449 and 450: Overview of PortfolioMall WTC Matah
- Page 451 and 452: Leased MallsFigure 4.1.1 Cibubur Ju
- Page 453 and 454: Leased MallsTable 4.1.3 Major tenan
- Page 455 and 456: Leased MallsTable 4.1.4 Cibubur Jun
- Page 457 and 458: Leased Malls4.1.7 SWOT analysisTabl
- Page 459 and 460: Leased Malls4.2 Plaza Semanggi4.2.1
- Page 461 and 462: Leased Mallsnumber of international
- Page 463 and 464: Leased MallsTaking the survey and t
- Page 465 and 466: Leased Malls• There are two major
- Page 467 and 468:
Leased Malls4.2.7 SWOT analysisTabl
- Page 469 and 470:
Leased Mallsterms of its very promi
- Page 471 and 472:
Leased MallsFigure 4.3.2 Bandung In
- Page 473 and 474:
Leased Malls• In terms of reasons
- Page 475 and 476:
Leased Mallsand approximately 38,00
- Page 477 and 478:
Leased MallsWhile BIP is likely to
- Page 479 and 480:
Leased MallsFigure 4.4.2 Istana Pla
- Page 481 and 482:
Leased Malls• The main reason sta
- Page 483 and 484:
Leased Malls• Cihampelas Walk is
- Page 485 and 486:
Leased MallsFigure 4.4.4: Istana Pl
- Page 487 and 488:
Leased MallsOn the completion of th
- Page 489 and 490:
Leased MallsThe target market for M
- Page 491 and 492:
Leased MallsThe current Hypermart e
- Page 493 and 494:
Leased MallsFigure 4.6.2 Gajah Mada
- Page 495 and 496:
Leased Malls• Of all the malls in
- Page 497 and 498:
Leased Mallshypermart. The centre a
- Page 499 and 500:
Leased Malls4.6.7 SWOT analysisTabl
- Page 501 and 502:
Leased MallsTable 4.6.7: Rental pos
- Page 503 and 504:
Leased Malls4.7.3 Tenant mixThe cur
- Page 505 and 506:
Leased Mallsprimarily the city of B
- Page 507 and 508:
Leased MallsTable 4.7.5: Main compe
- Page 509 and 510:
Retail Spaces Malls5. RETAIL SPACES
- Page 511 and 512:
Retail Spaces MallsIn addition, loc
- Page 513 and 514:
Retail Spaces MallsThe store target
- Page 515 and 516:
Retail Spaces MallsTable 5.3.1: Cen
- Page 517 and 518:
Retail Spaces MallsFigure 5.3.3: Gr
- Page 519 and 520:
Retail Spaces MallsThis relatively
- Page 521 and 522:
Retail Spaces MallsStrata title sho
- Page 523 and 524:
Retail Spaces MallsMadiun are locat
- Page 525 and 526:
Retail Spaces MallsFigure 5.6.3 Pla
- Page 527 and 528:
Retail Spaces MallsThe centre has t
- Page 529 and 530:
Appendix GTERMS, CONDITIONS AND PRO
- Page 531 and 532:
Appendix G(15) The Manager reserves
- Page 533 and 534:
Appendix GAdditional Terms and Cond
- Page 535 and 536:
Appendix G(10) By completing and de
- Page 537 and 538:
Appendix GAdditional Terms and Cond
- Page 539 and 540:
Appendix GWhere your Electronic App
- Page 541 and 542:
Appendix GApplication to the Manage
- Page 543 and 544:
Appendix GTerms and Conditions for
- Page 545 and 546:
Appendix HLIST OF PRESENT AND PAST
- Page 547 and 548:
Appendix H(6) Mr Tan Boon LeongCurr
- Page 549 and 550:
Appendix HCurrent DirectorshipsMapl
- Page 551 and 552:
Appendix HCurrent DirectorshipsMapl
- Page 553 and 554:
(This page intentionally left blank
- Page 555 and 556:
LIPPO-MAPLETREE INDONESIA RETAIL TR