Diapositive 1 - de l'Université libre de Bruxelles
Diapositive 1 - de l'Université libre de Bruxelles
Diapositive 1 - de l'Université libre de Bruxelles

You also want an ePaper? Increase the reach of your titles
YUMPU automatically turns print PDFs into web optimized ePapers that Google loves.
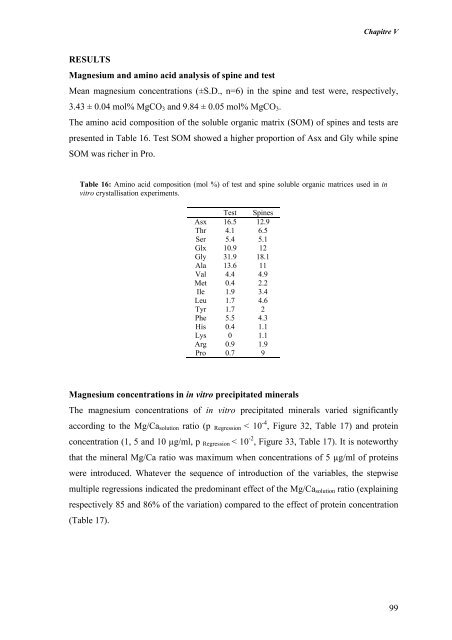
Chapitre VRESULTSMagnesium and amino acid analysis of spine and testMean magnesium concentrations (±S.D., n=6) in the spine and test were, respectively,3.43 ± 0.04 mol% MgCO 3 and 9.84 ± 0.05 mol% MgCO 3 .The amino acid composition of the soluble organic matrix (SOM) of spines and tests arepresented in Table 16. Test SOM showed a higher proportion of Asx and Gly while spineSOM was richer in Pro.Table 16: Amino acid composition (mol %) of test and spine soluble organic matrices used in invitro crystallisation experiments.Test SpinesAsx 16.5 12.9Thr 4.1 6.5Ser 5.4 5.1Glx 10.9 12Gly 31.9 18.1Ala 13.6 11Val 4.4 4.9Met 0.4 2.2Ile 1.9 3.4Leu 1.7 4.6Tyr 1.7 2Phe 5.5 4.3His 0.4 1.1Lys 0 1.1Arg 0.9 1.9Pro 0.7 9Magnesium concentrations in in vitro precipitated mineralsThe magnesium concentrations of in vitro precipitated minerals varied significantlyaccording to the Mg/Ca solution ratio (p Regression < 10 -4 , Figure 32, Table 17) and proteinconcentration (1, 5 and 10 µg/ml, p Regression < 10 -2 , Figure 33, Table 17). It is noteworthythat the mineral Mg/Ca ratio was maximum when concentrations of 5 µg/ml of proteinswere introduced. Whatever the sequence of introduction of the variables, the stepwisemultiple regressions indicated the predominant effect of the Mg/Ca solution ratio (explainingrespectively 85 and 86% of the variation) compared to the effect of protein concentration(Table 17).99