- Page 1 and 2:
ADVANCES IN FOSSIL FUELTECHNOLOGIES
- Page 3 and 4:
ADVANCES IN FOSSIL FUELTECHNOLOGIES
- Page 5 and 6:
CONTENTSABBREVIATIONSiiiPART ONEREP
- Page 7 and 8:
ABBREVIATIONSAC : Alternating curre
- Page 9:
OECD : Organization for Economic Co
- Page 12 and 13:
IORGANIZATION OF THE WORKSHOPA. Bac
- Page 14 and 15:
D. Election of officersThe followin
- Page 16 and 17:
IIICONSIDERATION OF ISSUESA. Backgr
- Page 18 and 19:
emissions. Underground coal gasific
- Page 20 and 21:
800 MWe, a steam pressure of 300 kg
- Page 22 and 23:
• Materials development & manufac
- Page 24 and 25:
Figure 1-5: Strategy for commercial
- Page 26 and 27:
tonnes, the state-owned enterprise
- Page 28 and 29:
• Ensuring not just easy FDI entr
- Page 30 and 31:
MW ultra-supercritical units; and s
- Page 32 and 33:
the captive generation capacity) on
- Page 34 and 35:
and other financial institutions -
- Page 36 and 37:
and higher efficiency power generat
- Page 38 and 39:
energy technologies, which can enab
- Page 40 and 41:
• Such massive financial inputs c
- Page 43 and 44:
BASELINE REPORT ON FOSSIL FUEL TECH
- Page 45 and 46:
B. General R&D climate in the count
- Page 47 and 48:
a convenient way to envisage energy
- Page 49 and 50:
to mature and become more cost-comp
- Page 51 and 52:
emissions, at least relative to sin
- Page 53 and 54:
The Ministry of Power (MoP), which
- Page 55 and 56:
3. Bio-energyBio-energy, widely ava
- Page 57 and 58:
in such a canal will rotate at a lo
- Page 59 and 60:
in tackling climate change. A one p
- Page 61 and 62:
Advantages of supercritical plants
- Page 63 and 64:
existing power plants but also to b
- Page 65 and 66:
BASELINE REPORT ON FOREIGN DIRECT I
- Page 67 and 68:
CEA at 598 mt. This is mainly due t
- Page 69 and 70:
For India to maintain its momentum
- Page 71 and 72:
Table 2-5: Electricity generation t
- Page 73 and 74:
Growth, which submitted its interim
- Page 75 and 76:
3. Future challengesThe future chal
- Page 77 and 78:
development worked out. Public-priv
- Page 79 and 80: Linking FDI to technology transferI
- Page 81 and 82: The total requirement of fund durin
- Page 83 and 84: Funding from multilateral agenciesM
- Page 85 and 86: cooperation will be essential in so
- Page 87: Planning Commission, Government of
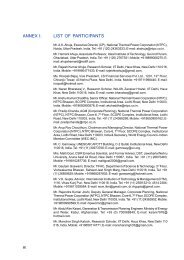
- Page 90 and 91: ANNEX I:LIST OF PARTICIPANTSMr. A.K
- Page 92 and 93: Mr. S.C. Shrivastava, Joint Chief (
- Page 94 and 95: ANNEX II:PROGRAMME6 June 2012, Wedn
- Page 96 and 97: ANNEX III:AN OVERVIEW OF ADVANCED F
- Page 98 and 99: • Technology solutions are also v
- Page 100 and 101: Table 3-5: Improvement in cycle eff
- Page 102 and 103: • No liquid effluent formation;
- Page 104 and 105: Figure 3-5: Advancement of gas turb
- Page 106 and 107: Figure 3-8: Goal 2 - New clean tech
- Page 108 and 109: Compared with conventional power pl
- Page 110 and 111: Figure 3-14: Thermax coal gasificat
- Page 112 and 113: ANNEX VII:GE ENERGY AND ADVANCED FO
- Page 114 and 115: ANNEX VIII:SWOT ANALYSIS OF FOSSIL
- Page 116 and 117: By 2035, cumulative CO 2emissions f
- Page 118 and 119: • Falling prices of renewable ene
- Page 120 and 121: Figure 3-20: New advanced coal powe
- Page 122 and 123: ANNEX X:ENERGY CONSERVATION: ERDA
- Page 124 and 125: Table 3-11: Energy cost and intensi
- Page 126 and 127: 300Figure 3-23: Trends in coal use
- Page 128 and 129: C. Gaps in coal use efficiencyFigur
- Page 132 and 133: With the entry of many private sect
- Page 134 and 135: for future requirements should be t
- Page 136 and 137: Short supply of coal has started af
- Page 138: Figure 3-35: Life-cycle of technolo


