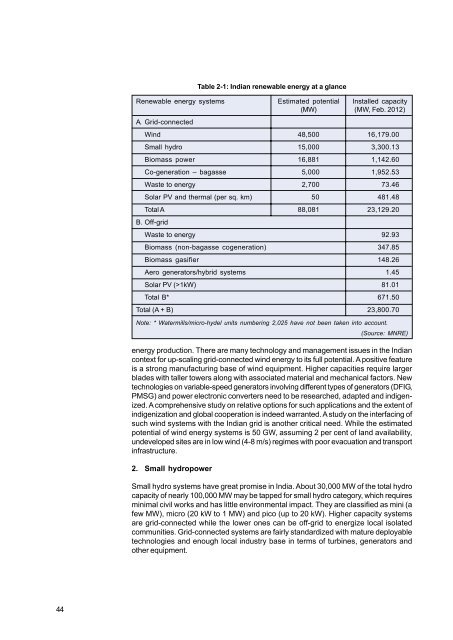
Table 2-1: Indian renewable energy at a glanceRenewable energy systems Estimated potential Installed capacity(MW) (MW, Feb. 2012)A. Grid-connectedWind 48,500 16,179.00Small hydro 15,000 3,300.13Biomass power 16,881 1,142.60Co-generation – bagasse 5,000 1,952.53Waste to energy 2,700 73.46Solar PV and thermal (per sq. km) 50 481.48Total A 88,081 23,129.20B. Off-gridWaste to energy 92.93Biomass (non-bagasse cogeneration) 347.85Biomass gasifier 148.26Aero generators/hybrid systems 1.45Solar PV (>1kW) 81.01Total B* 671.50Total (A + B) 23,800.70Note: * Watermills/micro-hydel units numbering 2,025 have not been taken into account.(Source: MNRE)energy production. There are many technology and management issues in the Indiancontext for up-scaling grid-connected wind energy to its full potential. A positive featureis a strong manufacturing base of wind equipment. Higher capacities require largerblades with taller towers along with associated material and mechanical factors. Newtechnologies on variable-speed generators involving different types of generators (DFIG,PMSG) and power electronic converters need to be researched, adapted and indigenized.A comprehensive study on relative options for such applications and the extent ofindigenization and global cooperation is indeed warranted. A study on the interfacing ofsuch wind systems with the Indian grid is another critical need. While the estimatedpotential of wind energy systems is 50 GW, assuming 2 per cent of land availability,undeveloped sites are in low wind (4-8 m/s) regimes with poor evacuation and transportinfrastructure.2. Small hydropowerSmall hydro systems have great promise in India. About 30,000 MW of the total hydrocapacity of nearly 100,000 MW may be tapped for small hydro category, which requiresminimal civil works and has little environmental impact. They are classified as mini (afew MW), micro (20 kW to 1 MW) and pico (up to 20 kW). Higher capacity systemsare grid-connected while the lower ones can be off-grid to energize local isolatedcommunities. Grid-connected systems are fairly standardized with mature deployabletechnologies and enough local industry base in terms of turbines, generators andother equipment.44
3. Bio-energyBio-energy, widely available in both rural and urban sectors, can be an attractive sourcefor electricity and heat. It has multiple variants – solid, liquid and gas – convertible toheat. In India, bio-energy is estimated to have 25,000 MW potential. Biomass powerplants account for about 1,000 MW of existing capacity. Bio-energy attracts annualinvestments of over US$40 billion, generates more than 7 billion units of electricity andcreates employment opportunities of more than 15 million work days in rural areas.Municipal solid waste (MSW), agro wastes, animal dung, forest residue, urban sewerage,bagasse, biomass and biofuels (from algae, jatropha, etc.) are some of the raw bioenergysources to be exploited. ‘Waste to Watts’ is a popular slogan that combineswaste management with power generation. Biothermal and biochemical processesare used to convert bio-energy sources to useable gas or liquid. Grid-connected systemsof unit sizes of 1 MW and above can be installed. India has the capacity and expertisefor producing the required equipment. Security of supply with price stability is crucial.Co-firing of coal-fed boilers with biomass is an option to save coal. Bagasse in sugarmills is a major source of co-generation. In view of multiple variants of bio-energy, thereare many inter-related issues to be studied. Conflicting interests of food versus energycall for judicious actions. Social forestry ‘tree to electricity’ scheme is an exciting areato be explored. Techno-economic and socially viable sources must be identified thatmay vary with local conditions. Standardization of technology and energy conversionequipment for bio-energy should be addressed.4. Solar energyIndia launched the Jawaharlal Nehru National Solar Mission in January 2010 for thedevelopment and deployment of solar energy technologies in the country. The Missionhas targeted 20,000 MW of solar power capacity (both thermal and PV) by 2022, withthe current (as of July 2011) installed capacity being 45 MW. The phased implementationhas targeted 1,000 MW by 2013. Cost and efficiency are issues that have limited thewidespread use of solar energy systems for both grid-connected and off-grid systems.Solar PV and solar thermal are the two routes. The cost of solar cells is claimed to befalling to a level of less than US$1/W. There are many technological challenges foreffective utilization of solar energy. The need for import of technology and equipment isa key concern for India, as it affects the energy security of the country. IndigenousR&D, coupled with local manufacture, is the way forward. Present penetration of solarenergy into the grid is negligible. Deployable technologies for PV panels and convertersystems to interface with the grid should be critically studied. Developing a solarenergizeddirect current (DC) micro-grid is an attractive option that eliminates invertersand alternating current (AC) grid interface problems if loads can be modified to work onDC supply.B. Off-grid renewable energy systemsTechnology requirements of grid-connected and off-grid systems using renewable energyare very different. The objective of off-grid systems is to provide quality power (constantvoltage, steady frequency, balanced and harmonics-free) to the consumer at varyingloads using available local energy sources. Each source will have distinct features onthe type of power it provides. A bio-energy-driven, governor-controlled engine will providevarying power to the load as per demand by adjusting the input fuel to the engine. It is45
- Page 1 and 2:
ADVANCES IN FOSSIL FUELTECHNOLOGIES
- Page 3 and 4: ADVANCES IN FOSSIL FUELTECHNOLOGIES
- Page 5 and 6: CONTENTSABBREVIATIONSiiiPART ONEREP
- Page 7 and 8: ABBREVIATIONSAC : Alternating curre
- Page 9: OECD : Organization for Economic Co
- Page 12 and 13: IORGANIZATION OF THE WORKSHOPA. Bac
- Page 14 and 15: D. Election of officersThe followin
- Page 16 and 17: IIICONSIDERATION OF ISSUESA. Backgr
- Page 18 and 19: emissions. Underground coal gasific
- Page 20 and 21: 800 MWe, a steam pressure of 300 kg
- Page 22 and 23: • Materials development & manufac
- Page 24 and 25: Figure 1-5: Strategy for commercial
- Page 26 and 27: tonnes, the state-owned enterprise
- Page 28 and 29: • Ensuring not just easy FDI entr
- Page 30 and 31: MW ultra-supercritical units; and s
- Page 32 and 33: the captive generation capacity) on
- Page 34 and 35: and other financial institutions -
- Page 36 and 37: and higher efficiency power generat
- Page 38 and 39: energy technologies, which can enab
- Page 40 and 41: • Such massive financial inputs c
- Page 43 and 44: BASELINE REPORT ON FOSSIL FUEL TECH
- Page 45 and 46: B. General R&D climate in the count
- Page 47 and 48: a convenient way to envisage energy
- Page 49 and 50: to mature and become more cost-comp
- Page 51 and 52: emissions, at least relative to sin
- Page 53: The Ministry of Power (MoP), which
- Page 57 and 58: in such a canal will rotate at a lo
- Page 59 and 60: in tackling climate change. A one p
- Page 61 and 62: Advantages of supercritical plants
- Page 63 and 64: existing power plants but also to b
- Page 65 and 66: BASELINE REPORT ON FOREIGN DIRECT I
- Page 67 and 68: CEA at 598 mt. This is mainly due t
- Page 69 and 70: For India to maintain its momentum
- Page 71 and 72: Table 2-5: Electricity generation t
- Page 73 and 74: Growth, which submitted its interim
- Page 75 and 76: 3. Future challengesThe future chal
- Page 77 and 78: development worked out. Public-priv
- Page 79 and 80: Linking FDI to technology transferI
- Page 81 and 82: The total requirement of fund durin
- Page 83 and 84: Funding from multilateral agenciesM
- Page 85 and 86: cooperation will be essential in so
- Page 87: Planning Commission, Government of
- Page 90 and 91: ANNEX I:LIST OF PARTICIPANTSMr. A.K
- Page 92 and 93: Mr. S.C. Shrivastava, Joint Chief (
- Page 94 and 95: ANNEX II:PROGRAMME6 June 2012, Wedn
- Page 96 and 97: ANNEX III:AN OVERVIEW OF ADVANCED F
- Page 98 and 99: • Technology solutions are also v
- Page 100 and 101: Table 3-5: Improvement in cycle eff
- Page 102 and 103: • No liquid effluent formation;
- Page 104 and 105:
Figure 3-5: Advancement of gas turb
- Page 106 and 107:
Figure 3-8: Goal 2 - New clean tech
- Page 108 and 109:
Compared with conventional power pl
- Page 110 and 111:
Figure 3-14: Thermax coal gasificat
- Page 112 and 113:
ANNEX VII:GE ENERGY AND ADVANCED FO
- Page 114 and 115:
ANNEX VIII:SWOT ANALYSIS OF FOSSIL
- Page 116 and 117:
By 2035, cumulative CO 2emissions f
- Page 118 and 119:
• Falling prices of renewable ene
- Page 120 and 121:
Figure 3-20: New advanced coal powe
- Page 122 and 123:
ANNEX X:ENERGY CONSERVATION: ERDA
- Page 124 and 125:
Table 3-11: Energy cost and intensi
- Page 126 and 127:
300Figure 3-23: Trends in coal use
- Page 128 and 129:
C. Gaps in coal use efficiencyFigur
- Page 130 and 131:
ANNEX XII:FINANCING OF THE POWER SE
- Page 132 and 133:
With the entry of many private sect
- Page 134 and 135:
for future requirements should be t
- Page 136 and 137:
Short supply of coal has started af
- Page 138:
Figure 3-35: Life-cycle of technolo