PDF (7.3 MB) - GILDEMEISTER Interim Report 3rd Quarter 2012
PDF (7.3 MB) - GILDEMEISTER Interim Report 3rd Quarter 2012
PDF (7.3 MB) - GILDEMEISTER Interim Report 3rd Quarter 2012
- No tags were found...

Create successful ePaper yourself
Turn your PDF publications into a flip-book with our unique Google optimized e-Paper software.
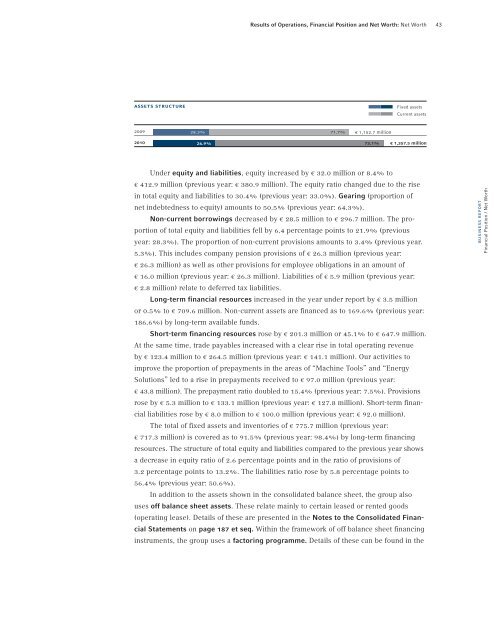
Results of Operations, Financial Position and Net Worth: Net Worth 43assets structureFixed assetsCurrent assets200928.3%71.7%€ 1,152.7 million201026.9% 73.1% € 1,357.5 millionUnder equity and liabilities, equity increased by € 32.0 million or 8.4% to€ 412.9 million (previous year: € 380.9 million). The equity ratio changed due to the risein total equity and liabilities to 30.4% (previous year: 33.0%). Gearing (proportion ofnet indebtedness to equity) amounts to 50.5% (previous year: 64.3%).Non-current borrowings decreased by € 28.5 million to € 296.7 million. The proportionof total equity and liabilities fell by 6.4 percentage points to 21.9% (previousyear: 28.3%). The proportion of non-current provisions amounts to 3.4% (previous year.5.3%). This includes company pension provisions of € 26.3 million (previous year:€ 26.3 million) as well as other provisions for employee obligations in an amount of€ 16.0 million (previous year: € 26.3 million). Liabilities of € 5.9 million (previous year:€ 2.8 million) relate to deferred tax liabilities.Long-term financial resources increased in the year under report by € 3.5 millionor 0.5% to € 709.6 million. Non-current assets are financed as to 169.6% (previous year:186.6%) by long-term available funds.Short-term financing resources rose by € 201.3 million or 45.1% to € 647.9 million.At the same time, trade payables increased with a clear rise in total operating revenueby € 123.4 million to € 264.5 million (previous year: € 141.1 million). Our activities toimprove the proportion of prepayments in the areas of “Machine Tools” and “EnergySolutions” led to a rise in prepayments received to € 97.0 million (previous year:€ 43.8 million). The prepayment ratio doubled to 15.4% (previous year: 7.5%). Provisionsrose by € 5.3 million to € 133.1 million (previous year: € 127.8 million). Short-term financialliabilities rose by € 8.0 million to € 100.0 million (previous year: € 92.0 million).The total of fixed assets and inventories of € 775.7 million (previous year:€ 71<strong>7.3</strong> million) is covered as to 91.5% (previous year: 98.4%) by long-term financingresources. The structure of total equity and liabilities compared to the previous year showsa decrease in equity ratio of 2.6 percentage points and in the ratio of provisions of3.2 percentage points to 13.2%. The liabilities ratio rose by 5.8 percentage points to56.4% (previous year: 50.6%).In addition to the assets shown in the consolidated balance sheet, the group alsouses off balance sheet assets. These relate mainly to certain leased or rented goods(operating lease). Details of these are presented in the Notes to the Consolidated FinancialStatements on page 187 et seq. Within the framework of off balance sheet financinginstruments, the group uses a factoring programme. Details of these can be found in thebusiness reportFinancial Position / Net Worth