

PDF: 1336 KB - Bureau of Infrastructure, Transport and Regional ...
PDF: 1336 KB - Bureau of Infrastructure, Transport and Regional ...
PDF: 1336 KB - Bureau of Infrastructure, Transport and Regional ...
- No tags were found...

Create successful ePaper yourself
Turn your PDF publications into a flip-book with our unique Google optimized e-Paper software.
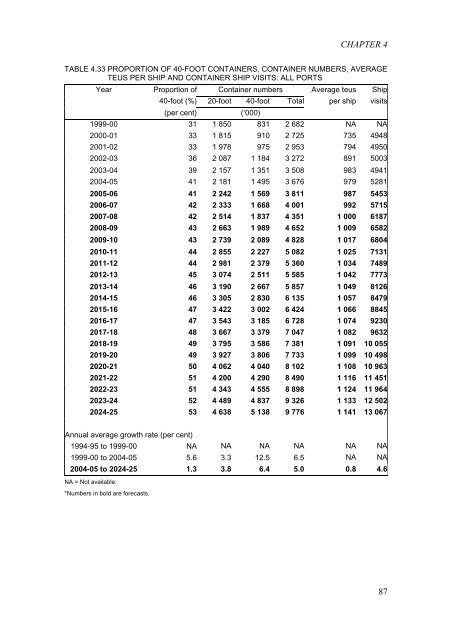
CHAPTER 4TABLE 4.33 PROPORTION OF 40-FOOT CONTAINERS, CONTAINER NUMBERS, AVERAGETEUS PER SHIP AND CONTAINER SHIP VISITS: ALL PORTSYear Proportion <strong>of</strong> Container numbers Average teus Ship40-foot (%) 20-foot 40-foot Total per ship visits(per cent) (‘000)1999-00 31 1 850 831 2 682 NA NA2000-01 33 1 815 910 2 725 735 49482001-02 33 1 978 975 2 953 794 49502002-03 36 2 087 1 184 3 272 891 50032003-04 39 2 157 1 351 3 508 983 49412004-05 41 2 181 1 495 3 676 979 52812005-06 41 2 242 1 569 3 811 987 54532006-07 42 2 333 1 668 4 001 992 57152007-08 42 2 514 1 837 4 351 1 000 61872008-09 43 2 663 1 989 4 652 1 009 65822009-10 43 2 739 2 089 4 828 1 017 68042010-11 44 2 855 2 227 5 082 1 025 71312011-12 44 2 981 2 379 5 360 1 034 74892012-13 45 3 074 2 511 5 585 1 042 77732013-14 46 3 190 2 667 5 857 1 049 81262014-15 46 3 305 2 830 6 135 1 057 84792015-16 47 3 422 3 002 6 424 1 066 88452016-17 47 3 543 3 185 6 728 1 074 92302017-18 48 3 667 3 379 7 047 1 082 96322018-19 49 3 795 3 586 7 381 1 091 10 0552019-20 49 3 927 3 806 7 733 1 099 10 4982020-21 50 4 062 4 040 8 102 1 108 10 9632021-22 51 4 200 4 290 8 490 1 116 11 4512022-23 51 4 343 4 555 8 898 1 124 11 9642023-24 52 4 489 4 837 9 326 1 133 12 5022024-25 53 4 638 5 138 9 776 1 141 13 067Annual average growth rate (per cent)1994-95 to 1999-00 NA NA NA NA NA NA1999-00 to 2004-05 5.6 3.3 12.5 6.5 NA NA2004-05 to 2024-25 1.3 3.8 6.4 5.0 0.8 4.6NA = Not available.*Numbers in bold are forecasts.87


