

PDF: 1336 KB - Bureau of Infrastructure, Transport and Regional ...
PDF: 1336 KB - Bureau of Infrastructure, Transport and Regional ...
PDF: 1336 KB - Bureau of Infrastructure, Transport and Regional ...
- No tags were found...

You also want an ePaper? Increase the reach of your titles
YUMPU automatically turns print PDFs into web optimized ePapers that Google loves.
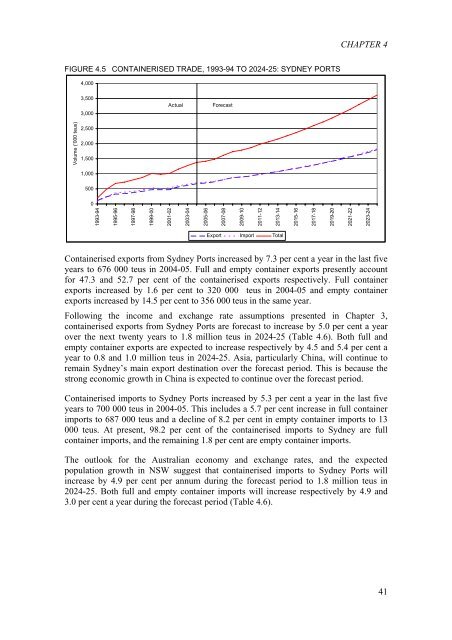
CHAPTER 4FIGURE 4.5 CONTAINERISED TRADE, 1993-94 TO 2024-25: SYDNEY PORTS4,0003,5003,000ActualForecastVolume ('000 teus)2,5002,0001,5001,00050001993-941995-961997-981999-002001-022003-042005-062007-082009-102011-122013-142015-162017-182019-202021-222023-24Export Import TotalContainerised exports from Sydney Ports increased by 7.3 per cent a year in the last fiveyears to 676 000 teus in 2004-05. Full <strong>and</strong> empty container exports presently accountfor 47.3 <strong>and</strong> 52.7 per cent <strong>of</strong> the containerised exports respectively. Full containerexports increased by 1.6 per cent to 320 000 teus in 2004-05 <strong>and</strong> empty containerexports increased by 14.5 per cent to 356 000 teus in the same year.Following the income <strong>and</strong> exchange rate assumptions presented in Chapter 3,containerised exports from Sydney Ports are forecast to increase by 5.0 per cent a yearover the next twenty years to 1.8 million teus in 2024-25 (Table 4.6). Both full <strong>and</strong>empty container exports are expected to increase respectively by 4.5 <strong>and</strong> 5.4 per cent ayear to 0.8 <strong>and</strong> 1.0 million teus in 2024-25. Asia, particularly China, will continue toremain Sydney’s main export destination over the forecast period. This is because thestrong economic growth in China is expected to continue over the forecast period.Containerised imports to Sydney Ports increased by 5.3 per cent a year in the last fiveyears to 700 000 teus in 2004-05. This includes a 5.7 per cent increase in full containerimports to 687 000 teus <strong>and</strong> a decline <strong>of</strong> 8.2 per cent in empty container imports to 13000 teus. At present, 98.2 per cent <strong>of</strong> the containerised imports to Sydney are fullcontainer imports, <strong>and</strong> the remaining 1.8 per cent are empty container imports.The outlook for the Australian economy <strong>and</strong> exchange rates, <strong>and</strong> the expectedpopulation growth in NSW suggest that containerised imports to Sydney Ports willincrease by 4.9 per cent per annum during the forecast period to 1.8 million teus in2024-25. Both full <strong>and</strong> empty container imports will increase respectively by 4.9 <strong>and</strong>3.0 per cent a year during the forecast period (Table 4.6).41


