- Page 2 and 3:
Bureau of Transport and Regional Ec
- Page 4:
FOREWORDThis report presents the na
- Page 7 and 8:
Other ships........................
- Page 9 and 10:
Table 4.3Table 4.4Proportion of 40-
- Page 11 and 12:
Table I.3Estimated regression stati
- Page 13 and 14:
Figure 4.12Figure 4.13Non-container
- Page 16 and 17:
EXECUTIVE SUMMARYBACKGROUNDInternat
- Page 18 and 19:
to 52 to 55 per cent in Brisbane, S
- Page 20 and 21:
containerised trade is forecast to
- Page 22 and 23:
next twenty years to 12.6 million t
- Page 24 and 25:
The total containerised trade of Po
- Page 26 and 27:
Other ports‘Other ports’ in thi
- Page 28:
CRUISE SHIPPING FORECASTSAustralia
- Page 31 and 32:
elation to the movement of containe
- Page 34 and 35:
CHAPTER 2 FREIGHT FORECASTING MODEL
- Page 36 and 37:
CHAPTER 2FIGURE 2.1 CONTAINERISED T
- Page 38 and 39:
CHAPTER 2FIGURE 2.3 NON-CONTAINERIS
- Page 40 and 41:
CHAPTER 2The exchange rate variable
- Page 42 and 43:
CHAPTER 2volume of containerised im
- Page 44 and 45:
CHAPTER 2appreciation (depreciation
- Page 46 and 47:
CHAPTER 2exports by 0.2 per cent in
- Page 48 and 49:
CHAPTER 2on the price of sea travel
- Page 50 and 51:
CHAPTER 3 FREIGHT MODELLING DATA AN
- Page 52 and 53:
CHAPTER 3containerised imports, but
- Page 54 and 55:
CHAPTER 3containers which are suita
- Page 56:
CHAPTER 3Non-container vessel sizeT
- Page 59 and 60:
agricultural commodities fell becau
- Page 61 and 62:
container imports and 2.5 per cent
- Page 63 and 64:
TABLE 4.2 INTERNATIONAL CONTAINERIS
- Page 65 and 66: FIGURE 4.3 NON-CONTAINERISED TRADE,
- Page 67 and 68: PBC is also developing an additiona
- Page 69 and 70: FIGURE 4.4 CARGO SHARES IN OUTBOUND
- Page 71 and 72: TABLE 4.6CONTAINERISED EXPORTS AND
- Page 73 and 74: TABLE 4.8 PROPORTION OF 40-FOOT CON
- Page 75 and 76: TABLE 4.9 NON-CONTAINERISED SEA TRA
- Page 77 and 78: increase by 1.3 per cent a year ove
- Page 79 and 80: FIGURE 4.7 CARGO SHARES IN OUTBOUND
- Page 81 and 82: per cent), Hong Kong (4.4 per cent)
- Page 83 and 84: TABLE 4.13 PROPORTION OF 40-FOOT CO
- Page 85 and 86: the Australian economy and the depr
- Page 87 and 88: facilitate the movement of containe
- Page 89 and 90: FIGURE 4.11 CONTAINERISED TRADE, 19
- Page 91 and 92: TABLE 4.17 INTERNATIONAL CONTAINERI
- Page 93 and 94: 55.3 per cent in 2003-04 largely du
- Page 95 and 96: TABLE 4.20 INTERNATIONAL NON-CONTAI
- Page 97 and 98: it accounts for 15 per cent of outb
- Page 99 and 100: TABLE 4.21 CONTAINERISED EXPORTS AN
- Page 101 and 102: TABLE 4.23 PROPORTION OF 40-FOOT CO
- Page 103 and 104: TABLE 4.24 NON-CONTAINERISED SEA TR
- Page 105 and 106: The capacity of Fremantle Port will
- Page 107 and 108: 2024-25, whereas international non-
- Page 109 and 110: TABLE 4.28 PROPORTION OF 40-FOOT CO
- Page 111 and 112: TABLE 4.29 NON-CONTAINERISED SEA TR
- Page 113 and 114: 25. International containerised exp
- Page 115: TABLE 4.32 INTERNATIONAL CONTAINERI
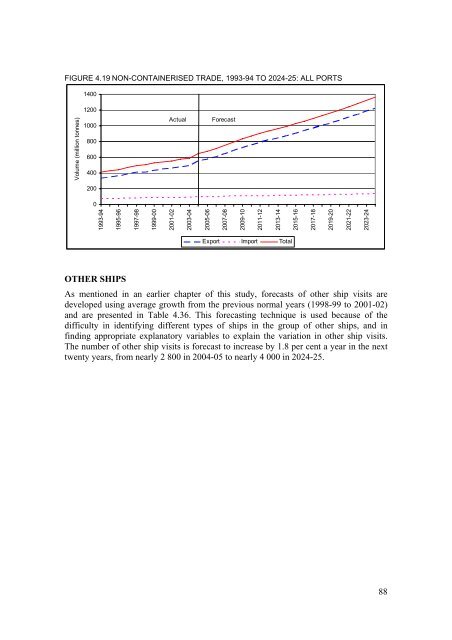
- Page 119 and 120: TABLE 4.35 INTERNATIONAL NON-CONTAI
- Page 122 and 123: CHAPTER 5 FORECASTS OF CRUISE PASSE
- Page 124 and 125: Chapter 5Cruising typesThe cruising
- Page 126 and 127: Chapter 510.0 per cent each and the
- Page 128 and 129: Chapter 5Similarly, ship capacity o
- Page 130 and 131: Chapter 5FIGURE 5.3 SHORT-TERM SEA
- Page 132 and 133: APPENDIX IESTIMATED REGRESSION STAT
- Page 134 and 135: APPENDIX IITABLE I.3Variable by por
- Page 136 and 137: APPENDIX IITABLE I.5Variable by por
- Page 138: APPENDIX IITABLE I.7Variable by por
- Page 141 and 142: DVB 2004, The Cruise Industry and i
- Page 144: ABBREVIATIONSABS Australian Bureau