

PDF: 1336 KB - Bureau of Infrastructure, Transport and Regional ...
PDF: 1336 KB - Bureau of Infrastructure, Transport and Regional ...
PDF: 1336 KB - Bureau of Infrastructure, Transport and Regional ...
- No tags were found...

You also want an ePaper? Increase the reach of your titles
YUMPU automatically turns print PDFs into web optimized ePapers that Google loves.
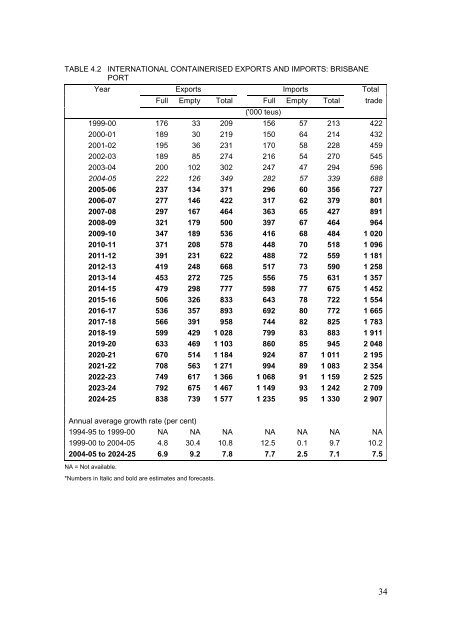
TABLE 4.2 INTERNATIONAL CONTAINERISED EXPORTS AND IMPORTS: BRISBANEPORTYear Exports Imports TotalFull Empty Total Full Empty Total trade('000 teus)1999-00 176 33 209 156 57 213 4222000-01 189 30 219 150 64 214 4322001-02 195 36 231 170 58 228 4592002-03 189 85 274 216 54 270 5452003-04 200 102 302 247 47 294 5962004-05 222 126 349 282 57 339 6882005-06 237 134 371 296 60 356 7272006-07 277 146 422 317 62 379 8012007-08 297 167 464 363 65 427 8912008-09 321 179 500 397 67 464 9642009-10 347 189 536 416 68 484 1 0202010-11 371 208 578 448 70 518 1 0962011-12 391 231 622 488 72 559 1 1812012-13 419 248 668 517 73 590 1 2582013-14 453 272 725 556 75 631 1 3572014-15 479 298 777 598 77 675 1 4522015-16 506 326 833 643 78 722 1 5542016-17 536 357 893 692 80 772 1 6652017-18 566 391 958 744 82 825 1 7832018-19 599 429 1 028 799 83 883 1 9112019-20 633 469 1 103 860 85 945 2 0482020-21 670 514 1 184 924 87 1 011 2 1952021-22 708 563 1 271 994 89 1 083 2 3542022-23 749 617 1 366 1 068 91 1 159 2 5252023-24 792 675 1 467 1 149 93 1 242 2 7092024-25 838 739 1 577 1 235 95 1 330 2 907Annual average growth rate (per cent)1994-95 to 1999-00 NA NA NA NA NA NA NA1999-00 to 2004-05 4.8 30.4 10.8 12.5 0.1 9.7 10.22004-05 to 2024-25 6.9 9.2 7.8 7.7 2.5 7.1 7.5NA = Not available.*Numbers in Italic <strong>and</strong> bold are estimates <strong>and</strong> forecasts.34


