

PDF: 1336 KB - Bureau of Infrastructure, Transport and Regional ...
PDF: 1336 KB - Bureau of Infrastructure, Transport and Regional ...
PDF: 1336 KB - Bureau of Infrastructure, Transport and Regional ...
- No tags were found...

You also want an ePaper? Increase the reach of your titles
YUMPU automatically turns print PDFs into web optimized ePapers that Google loves.
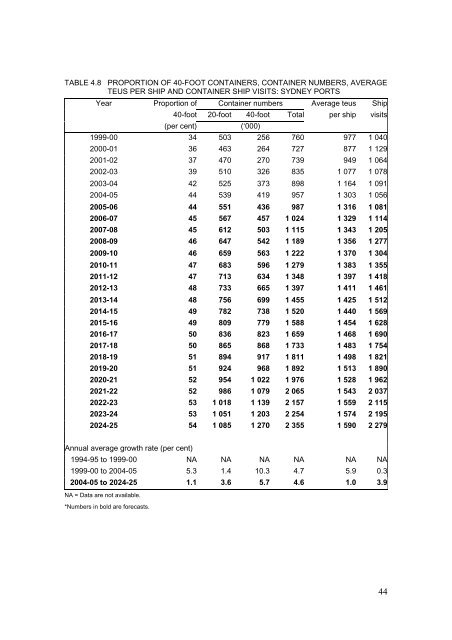
TABLE 4.8 PROPORTION OF 40-FOOT CONTAINERS, CONTAINER NUMBERS, AVERAGETEUS PER SHIP AND CONTAINER SHIP VISITS: SYDNEY PORTSYear Proportion <strong>of</strong> Container numbers Average teus Ship40-foot 20-foot 40-foot Total per ship visits(per cent) (‘000)1999-00 34 503 256 760 977 1 0402000-01 36 463 264 727 877 1 1292001-02 37 470 270 739 949 1 0642002-03 39 510 326 835 1 077 1 0782003-04 42 525 373 898 1 164 1 0912004-05 44 539 419 957 1 303 1 0562005-06 44 551 436 987 1 316 1 0812006-07 45 567 457 1 024 1 329 1 1142007-08 45 612 503 1 115 1 343 1 2052008-09 46 647 542 1 189 1 356 1 2772009-10 46 659 563 1 222 1 370 1 3042010-11 47 683 596 1 279 1 383 1 3552011-12 47 713 634 1 348 1 397 1 4182012-13 48 733 665 1 397 1 411 1 4612013-14 48 756 699 1 455 1 425 1 5122014-15 49 782 738 1 520 1 440 1 5692015-16 49 809 779 1 588 1 454 1 6282016-17 50 836 823 1 659 1 468 1 6902017-18 50 865 868 1 733 1 483 1 7542018-19 51 894 917 1 811 1 498 1 8212019-20 51 924 968 1 892 1 513 1 8902020-21 52 954 1 022 1 976 1 528 1 9622021-22 52 986 1 079 2 065 1 543 2 0372022-23 53 1 018 1 139 2 157 1 559 2 1152023-24 53 1 051 1 203 2 254 1 574 2 1952024-25 54 1 085 1 270 2 355 1 590 2 279Annual average growth rate (per cent)1994-95 to 1999-00 NA NA NA NA NA NA1999-00 to 2004-05 5.3 1.4 10.3 4.7 5.9 0.32004-05 to 2024-25 1.1 3.6 5.7 4.6 1.0 3.9NA = Data are not available.*Numbers in bold are forecasts.44


