

PDF: 1336 KB - Bureau of Infrastructure, Transport and Regional ...
PDF: 1336 KB - Bureau of Infrastructure, Transport and Regional ...
PDF: 1336 KB - Bureau of Infrastructure, Transport and Regional ...
- No tags were found...

You also want an ePaper? Increase the reach of your titles
YUMPU automatically turns print PDFs into web optimized ePapers that Google loves.
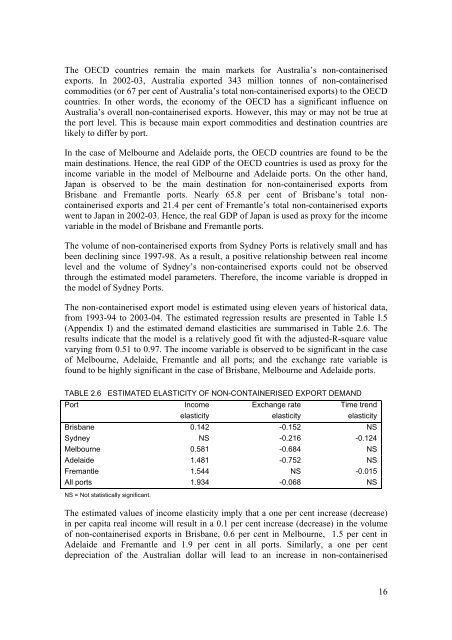
The OECD countries remain the main markets for Australia’s non-containerisedexports. In 2002-03, Australia exported 343 million tonnes <strong>of</strong> non-containerisedcommodities (or 67 per cent <strong>of</strong> Australia’s total non-containerised exports) to the OECDcountries. In other words, the economy <strong>of</strong> the OECD has a significant influence onAustralia’s overall non-containerised exports. However, this may or may not be true atthe port level. This is because main export commodities <strong>and</strong> destination countries arelikely to differ by port.In the case <strong>of</strong> Melbourne <strong>and</strong> Adelaide ports, the OECD countries are found to be themain destinations. Hence, the real GDP <strong>of</strong> the OECD countries is used as proxy for theincome variable in the model <strong>of</strong> Melbourne <strong>and</strong> Adelaide ports. On the other h<strong>and</strong>,Japan is observed to be the main destination for non-containerised exports fromBrisbane <strong>and</strong> Fremantle ports. Nearly 65.8 per cent <strong>of</strong> Brisbane’s total noncontainerisedexports <strong>and</strong> 21.4 per cent <strong>of</strong> Fremantle’s total non-containerised exportswent to Japan in 2002-03. Hence, the real GDP <strong>of</strong> Japan is used as proxy for the incomevariable in the model <strong>of</strong> Brisbane <strong>and</strong> Fremantle ports.The volume <strong>of</strong> non-containerised exports from Sydney Ports is relatively small <strong>and</strong> hasbeen declining since 1997-98. As a result, a positive relationship between real incomelevel <strong>and</strong> the volume <strong>of</strong> Sydney’s non-containerised exports could not be observedthrough the estimated model parameters. Therefore, the income variable is dropped inthe model <strong>of</strong> Sydney Ports.The non-containerised export model is estimated using eleven years <strong>of</strong> historical data,from 1993-94 to 2003-04. The estimated regression results are presented in Table I.5(Appendix I) <strong>and</strong> the estimated dem<strong>and</strong> elasticities are summarised in Table 2.6. Theresults indicate that the model is a relatively good fit with the adjusted-R-square valuevarying from 0.51 to 0.97. The income variable is observed to be significant in the case<strong>of</strong> Melbourne, Adelaide, Fremantle <strong>and</strong> all ports; <strong>and</strong> the exchange rate variable isfound to be highly significant in the case <strong>of</strong> Brisbane, Melbourne <strong>and</strong> Adelaide ports.TABLE 2.6 ESTIMATED ELASTICITY OF NON-CONTAINERISED EXPORT DEMANDPortIncomeelasticityExchange rateelasticityTime trendelasticityBrisbane 0.142 -0.152 NSSydney NS -0.216 -0.124Melbourne 0.581 -0.684 NSAdelaide 1.481 -0.752 NSFremantle 1.544 NS -0.015All ports 1.934 -0.068 NSNS = Not statistically significant.The estimated values <strong>of</strong> income elasticity imply that a one per cent increase (decrease)in per capita real income will result in a 0.1 per cent increase (decrease) in the volume<strong>of</strong> non-containerised exports in Brisbane, 0.6 per cent in Melbourne, 1.5 per cent inAdelaide <strong>and</strong> Fremantle <strong>and</strong> 1.9 per cent in all ports. Similarly, a one per centdepreciation <strong>of</strong> the Australian dollar will lead to an increase in non-containerised16


