

PDF: 1336 KB - Bureau of Infrastructure, Transport and Regional ...
PDF: 1336 KB - Bureau of Infrastructure, Transport and Regional ...
PDF: 1336 KB - Bureau of Infrastructure, Transport and Regional ...
- No tags were found...

You also want an ePaper? Increase the reach of your titles
YUMPU automatically turns print PDFs into web optimized ePapers that Google loves.
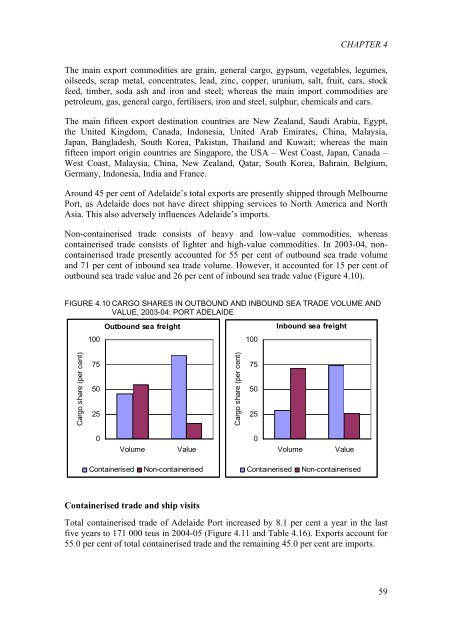
CHAPTER 4The main export commodities are grain, general cargo, gypsum, vegetables, legumes,oilseeds, scrap metal, concentrates, lead, zinc, copper, uranium, salt, fruit, cars, stockfeed, timber, soda ash <strong>and</strong> iron <strong>and</strong> steel; whereas the main import commodities arepetroleum, gas, general cargo, fertilisers, iron <strong>and</strong> steel, sulphur, chemicals <strong>and</strong> cars.The main fifteen export destination countries are New Zeal<strong>and</strong>, Saudi Arabia, Egypt,the United Kingdom, Canada, Indonesia, United Arab Emirates, China, Malaysia,Japan, Bangladesh, South Korea, Pakistan, Thail<strong>and</strong> <strong>and</strong> Kuwait; whereas the mainfifteen import origin countries are Singapore, the USA – West Coast, Japan, Canada –West Coast, Malaysia, China, New Zeal<strong>and</strong>, Qatar, South Korea, Bahrain, Belgium,Germany, Indonesia, India <strong>and</strong> France.Around 45 per cent <strong>of</strong> Adelaide’s total exports are presently shipped through MelbournePort, as Adelaide does not have direct shipping services to North America <strong>and</strong> NorthAsia. This also adversely influences Adelaide’s imports.Non-containerised trade consists <strong>of</strong> heavy <strong>and</strong> low-value commodities, whereascontainerised trade consists <strong>of</strong> lighter <strong>and</strong> high-value commodities. In 2003-04, noncontainerisedtrade presently accounted for 55 per cent <strong>of</strong> outbound sea trade volume<strong>and</strong> 71 per cent <strong>of</strong> inbound sea trade volume. However, it accounted for 15 per cent <strong>of</strong>outbound sea trade value <strong>and</strong> 26 per cent <strong>of</strong> inbound sea trade value (Figure 4.10).FIGURE 4.10 CARGO SHARES IN OUTBOUND AND INBOUND SEA TRADE VOLUME ANDVALUE, 2003-04: PORT ADELAIDEOutbound sea freightInbound sea freight100100Cargo share (per cent)755025Cargo share (per cent)7550250VolumeValue0VolumeValueContainerisedNon-containerisedContainerisedNon-containerisedContainerised trade <strong>and</strong> ship visitsTotal containerised trade <strong>of</strong> Adelaide Port increased by 8.1 per cent a year in the lastfive years to 171 000 teus in 2004-05 (Figure 4.11 <strong>and</strong> Table 4.16). Exports account for55.0 per cent <strong>of</strong> total containerised trade <strong>and</strong> the remaining 45.0 per cent are imports.59


