PDF: 1336 KB - Bureau of Infrastructure, Transport and Regional ...
PDF: 1336 KB - Bureau of Infrastructure, Transport and Regional ...
PDF: 1336 KB - Bureau of Infrastructure, Transport and Regional ...
- No tags were found...
You also want an ePaper? Increase the reach of your titles
YUMPU automatically turns print PDFs into web optimized ePapers that Google loves.
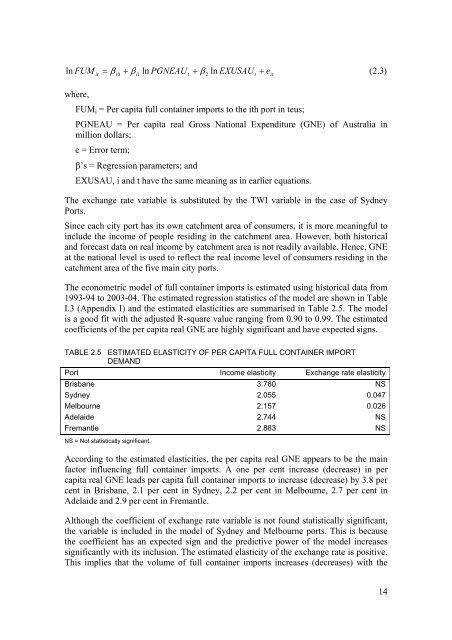
ln FUMit= βi+ βi1ln PGNEAUt+ β2ln EXUSAUt+ e0 it(2.3)where,FUM i = Per capita full container imports to the ith port in teus;PGNEAU = Per capita real Gross National Expenditure (GNE) <strong>of</strong> Australia inmillion dollars;e = Error term;β’s = Regression parameters; <strong>and</strong>EXUSAU, i <strong>and</strong> t have the same meaning as in earlier equations.The exchange rate variable is substituted by the TWI variable in the case <strong>of</strong> SydneyPorts.Since each city port has its own catchment area <strong>of</strong> consumers, it is more meaningful toinclude the income <strong>of</strong> people residing in the catchment area. However, both historical<strong>and</strong> forecast data on real income by catchment area is not readily available. Hence, GNEat the national level is used to reflect the real income level <strong>of</strong> consumers residing in thecatchment area <strong>of</strong> the five main city ports.The econometric model <strong>of</strong> full container imports is estimated using historical data from1993-94 to 2003-04. The estimated regression statistics <strong>of</strong> the model are shown in TableI.3 (Appendix I) <strong>and</strong> the estimated elasticities are summarised in Table 2.5. The modelis a good fit with the adjusted R-square value ranging from 0.90 to 0.99. The estimatedcoefficients <strong>of</strong> the per capita real GNE are highly significant <strong>and</strong> have expected signs.TABLE 2.5 ESTIMATED ELASTICITY OF PER CAPITA FULL CONTAINER IMPORTDEMANDPort Income elasticity Exchange rate elasticityBrisbane 3.780 NSSydney 2.055 0.047Melbourne 2.157 0.026Adelaide 2.744 NSFremantle 2.883 NSNS = Not statistically significant.According to the estimated elasticities, the per capita real GNE appears to be the mainfactor influencing full container imports. A one per cent increase (decrease) in percapita real GNE leads per capita full container imports to increase (decrease) by 3.8 percent in Brisbane, 2.1 per cent in Sydney, 2.2 per cent in Melbourne, 2.7 per cent inAdelaide <strong>and</strong> 2.9 per cent in Fremantle.Although the coefficient <strong>of</strong> exchange rate variable is not found statistically significant,the variable is included in the model <strong>of</strong> Sydney <strong>and</strong> Melbourne ports. This is becausethe coefficient has an expected sign <strong>and</strong> the predictive power <strong>of</strong> the model increasessignificantly with its inclusion. The estimated elasticity <strong>of</strong> the exchange rate is positive.This implies that the volume <strong>of</strong> full container imports increases (decreases) with the14


