The Winton M. Blount Postal History Symposia - Smithsonian ...
The Winton M. Blount Postal History Symposia - Smithsonian ...
The Winton M. Blount Postal History Symposia - Smithsonian ...
- No tags were found...

Create successful ePaper yourself
Turn your PDF publications into a flip-book with our unique Google optimized e-Paper software.
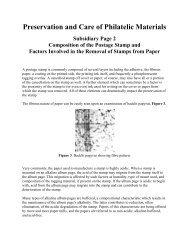
n u m b e r 5 5 • 3 1receipts. DeBlois and Harris analyzed the postal receiptsof small post offices in Rensselaer County, N.Y., andfound examples of the exquisite sensitivity of the OR datato local events. 12 For example, for the period 1827 to 1833the receipts of the Sand Lake post office grew at more thanthe national average. When other post offices were openedin the vicinity of Sand Lake, that office’s receipts dropped.<strong>The</strong> receipts of the Sand Lake post office showed a sharpdrop between 1851 and 1853, a drop not seen to any greatextend in the other regional offices. DeBlois and Harrisnote that on December 25, 1852, a glass factory in SandLake was destroyed by fire. <strong>The</strong>y argue that since the factorywas the major industry in the town, this loss can explainthe greater decline in revenues from this office.<strong>The</strong> original printed volumes of the Official Registerare extremely rare. Even the largest institutional librariesdo not have anything approaching a complete set. Such aset does exist in the collection of the Library of Congress.However, efforts are now under way to digitize the ORdata through the 1871 volume. 13OR Data and Economic VariablesThis section provides a preliminary analysis, using thedata from New Hampshire post offices, of the relationshipsbetween postmaster compensation data and economic anddemographic variables. New Hampshire was chosen becauseone of us (TH) has copies of the New Hampshiredate from all the ORs and because New Hampshire is theonly state for which census data is available on-line. Thisdata can be found at the web site of the New HampshireHistorical Society, www.nhhistory.org.<strong>The</strong> specific date reported in the OR varied over thealmost one hundred years of this title’s publication. Forthe entire period, 1816 through 1911, compensation foreach postmaster is reported. For the years 1841 through1869, in addition, the “net proceeds” at each office arereported. Adding the compensation to the proceeds resultsin the total postal income for the post office that year. 14While it was always the case that as postal incomeincreased, postmaster compensation increased, this relationwas not a simple one but an incremental one. Thatis, as income increased, postmasters received a decreasingpercentage of incremental income. Further, the exact formulafor compensation varied over the years as Congressaltered the way postmaster compensation was computed.<strong>The</strong> details of these changes in compensation rates are beyondthe scope of this paper but can be found in JointCommission on <strong>Postal</strong> Salaries. 15 As an example, underthe Act of June 22, 1854, postmasters received sixty percentof the first $100 of income, fifty percent of the next$300, forty percent of the next $2,000 and fifteen percenton all income over $2,400.<strong>The</strong> incremental nature of the compensation formulaepresents a problem for some statistical analyses. This is becausethe formulae result in distributions of compensationvalues that have smaller variances than the distributions ofactual income values. In other words, the distributions ofcompensations are compacted relative to the distributionsof actual incomes. Especially for correlational analyses, therestricted range of the compensation data may cause oneto miss effects that would be found were the total postalincome data, with its greater variance, to be used. This, ofcourse, isn’t a problem for those years when both compensationand net proceeds are provided as one may simplyadd the two (but see below). However, for years whereonly compensation is provided, it is necessary to calculatethe income based on the compensation schedules providedin the Joint Commission on <strong>Postal</strong> Salaries publication. 16Happily, for most years this is rather straightforward.Preliminary AnalysesBefore undertaking an analysis of the compensationdata, it is important to establish that the basic data ofpostal income is economically relevant. One way to approachthis question is to examine postal income data atthe national level and see if it is correlated with importanteconomic variables. <strong>The</strong> 1911 Annual Report of the PostmasterGeneral gives the audited postal revenues for eachfiscal year from 1837 through 1911. 17 <strong>The</strong>se figures werecorrelated with the nominal Gross Domestic Product ofthe corresponding years taken from the on-line economichistory database at www.eh.net. <strong>The</strong> resulting Pearsonproduct-moment correlation is r = + .976 (p < .001). Thisvery high correlation shows that, at least at the nationallevel, postal revenues do correlate impressively with GDPand thus suggests that postal revenues do reflect economicactivity. For even earlier years, the 1831 Annual Reportof the Postmaster General reported total postal receiptsfor 1789 through 1830. 18 Correlating these numbers withnominal GDP (starting with 1790–nGDP is not availablefor 1789) resulted in another high correlation: r = + .84(p < .001). <strong>The</strong>se high correlations gave us some confidencethat postal data have some relationship to economicfactors and spurred further analyses.As noted above, for some years the OR reportedonly the postmasters’ compensation. Using the formulae