RAINFOR GEM Intensive Plots Manual (pdf) - University of Oxford
RAINFOR GEM Intensive Plots Manual (pdf) - University of Oxford
RAINFOR GEM Intensive Plots Manual (pdf) - University of Oxford
- No tags were found...

You also want an ePaper? Increase the reach of your titles
YUMPU automatically turns print PDFs into web optimized ePapers that Google loves.
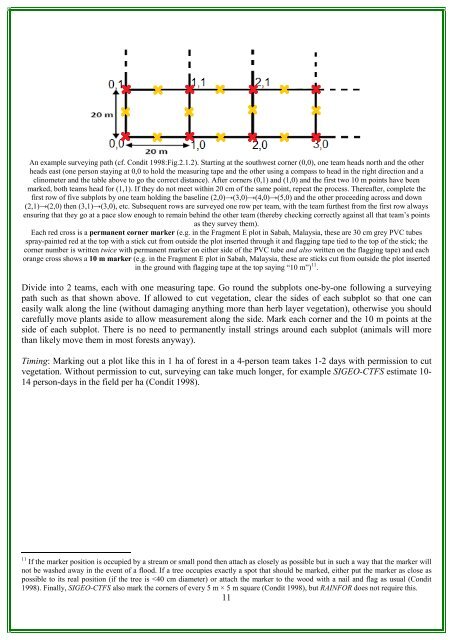
An example surveying path (cf. Condit 1998:Fig.2.1.2). Starting at the southwest corner (0,0), one team heads north and the otherheads east (one person staying at 0,0 to hold the measuring tape and the other using a compass to head in the right direction and aclinometer and the table above to go the correct distance). After corners (0,1) and (1,0) and the first two 10 m points have beenmarked, both teams head for (1,1). If they do not meet within 20 cm <strong>of</strong> the same point, repeat the process. Thereafter, complete thefirst row <strong>of</strong> five subplots by one team holding the baseline (2,0)→(3,0)→(4,0)→(5,0) and the other proceeding across and down(2,1)→(2,0) then (3,1)→(3,0), etc. Subsequent rows are surveyed one row per team, with the team furthest from the first row alwaysensuring that they go at a pace slow enough to remain behind the other team (thereby checking correctly against all that team’s pointsas they survey them).Each red cross is a permanent corner marker (e.g. in the Fragment E plot in Sabah, Malaysia, these are 30 cm grey PVC tubesspray-painted red at the top with a stick cut from outside the plot inserted through it and flagging tape tied to the top <strong>of</strong> the stick; thecorner number is written twice with permanent marker on either side <strong>of</strong> the PVC tube and also written on the flagging tape) and eachorange cross shows a 10 m marker (e.g. in the Fragment E plot in Sabah, Malaysia, these are sticks cut from outside the plot insertedin the ground with flagging tape at the top saying “10 m”) 11 .Divide into 2 teams, each with one measuring tape. Go round the subplots one-by-one following a surveyingpath such as that shown above. If allowed to cut vegetation, clear the sides <strong>of</strong> each subplot so that one caneasily walk along the line (without damaging anything more than herb layer vegetation), otherwise you shouldcarefully move plants aside to allow measurement along the side. Mark each corner and the 10 m points at theside <strong>of</strong> each subplot. There is no need to permanently install strings around each subplot (animals will morethan likely move them in most forests anyway).Timing: Marking out a plot like this in 1 ha <strong>of</strong> forest in a 4-person team takes 1-2 days with permission to cutvegetation. Without permission to cut, surveying can take much longer, for example SIGEO-CTFS estimate 10-14 person-days in the field per ha (Condit 1998).11 If the marker position is occupied by a stream or small pond then attach as closely as possible but in such a way that the marker willnot be washed away in the event <strong>of</strong> a flood. If a tree occupies exactly a spot that should be marked, either put the marker as close aspossible to its real position (if the tree is