RAINFOR GEM Intensive Plots Manual (pdf) - University of Oxford
RAINFOR GEM Intensive Plots Manual (pdf) - University of Oxford
RAINFOR GEM Intensive Plots Manual (pdf) - University of Oxford
- No tags were found...
You also want an ePaper? Increase the reach of your titles
YUMPU automatically turns print PDFs into web optimized ePapers that Google loves.
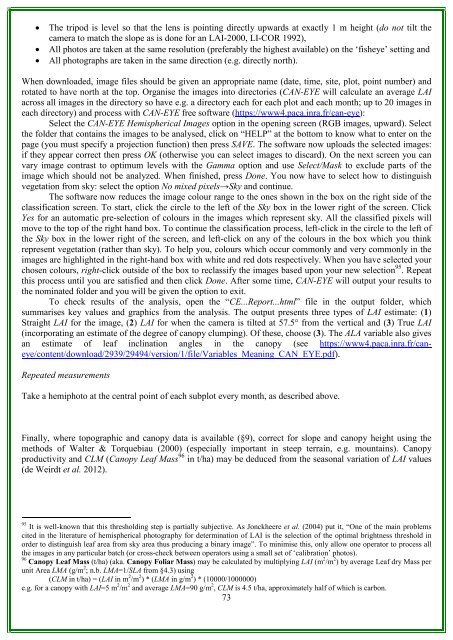
• The tripod is level so that the lens is pointing directly upwards at exactly 1 m height (do not tilt thecamera to match the slope as is done for an LAI-2000, LI-COR 1992),• All photos are taken at the same resolution (preferably the highest available) on the ‘fisheye’ setting and• All photographs are taken in the same direction (e.g. directly north).When downloaded, image files should be given an appropriate name (date, time, site, plot, point number) androtated to have north at the top. Organise the images into directories (CAN-EYE will calculate an average LAIacross all images in the directory so have e.g. a directory each for each plot and each month; up to 20 images ineach directory) and process with CAN-EYE free s<strong>of</strong>tware (https://www4.paca.inra.fr/can-eye):Select the CAN-EYE Hemispherical Images option in the opening screen (RGB images, upward). Selectthe folder that contains the images to be analysed, click on “HELP” at the bottom to know what to enter on thepage (you must specify a projection function) then press SAVE. The s<strong>of</strong>tware now uploads the selected images:if they appear correct then press OK (otherwise you can select images to discard). On the next screen you canvary image contrast to optimum levels with the Gamma option and use Select/Mask to exclude parts <strong>of</strong> theimage which should not be analyzed. When finished, press Done. You now have to select how to distinguishvegetation from sky: select the option No mixed pixels→Sky and continue.The s<strong>of</strong>tware now reduces the image colour range to the ones shown in the box on the right side <strong>of</strong> theclassification screen. To start, click the circle to the left <strong>of</strong> the Sky box in the lower right <strong>of</strong> the screen. ClickYes for an automatic pre-selection <strong>of</strong> colours in the images which represent sky. All the classified pixels willmove to the top <strong>of</strong> the right hand box. To continue the classification process, left-click in the circle to the left <strong>of</strong>the Sky box in the lower right <strong>of</strong> the screen, and left-click on any <strong>of</strong> the colours in the box which you thinkrepresent vegetation (rather than sky). To help you, colours which occur commonly and very commonly in theimages are highlighted in the right-hand box with white and red dots respectively. When you have selected yourchosen colours, right-click outside <strong>of</strong> the box to reclassify the images based upon your new selection 95 . Repeatthis process until you are satisfied and then click Done. After some time, CAN-EYE will output your results tothe nominated folder and you will be given the option to exit.To check results <strong>of</strong> the analysis, open the “CE...Report...html” file in the output folder, whichsummarises key values and graphics from the analysis. The output presents three types <strong>of</strong> LAI estimate: (1)Straight LAI for the image, (2) LAI for when the camera is tilted at 57.5° from the vertical and (3) True LAI(incorporating an estimate <strong>of</strong> the degree <strong>of</strong> canopy clumping). Of these, choose (3). The ALA variable also givesan estimate <strong>of</strong> leaf inclination angles in the canopy (see https://www4.paca.inra.fr/caneye/content/download/2939/29494/version/1/file/Variables_Meaning_CAN_EYE.<strong>pdf</strong>).Repeated measurementsTake a hemiphoto at the central point <strong>of</strong> each subplot every month, as described above.Finally, where topographic and canopy data is available (§9), correct for slope and canopy height using themethods <strong>of</strong> Walter & Torquebiau (2000) (especially important in steep terrain, e.g. mountains). Canopyproductivity and CLM (Canopy Leaf Mass 96 in t/ha) may be deduced from the seasonal variation <strong>of</strong> LAI values(de Weirdt et al. 2012).95 It is well-known that this thresholding step is partially subjective. As Jonckheere et al. (2004) put it, “One <strong>of</strong> the main problemscited in the literature <strong>of</strong> hemispherical photography for determination <strong>of</strong> LAI is the selection <strong>of</strong> the optimal brightness threshold inorder to distinguish leaf area from sky area thus producing a binary image”. To minimise this, only allow one operator to process allthe images in any particular batch (or cross-check between operators using a small set <strong>of</strong> ‘calibration’ photos).96 Canopy Leaf Mass (t/ha) (aka. Canopy Foliar Mass) may be calculated by multiplying LAI (m 2 /m 2 ) by average Leaf dry Mass perunit Area LMA (g/m 2 ; n.b. LMA=1/SLA from §4.3) using(CLM in t/ha) = (LAI in m 2 /m 2 ) * (LMA in g/m 2 ) * (10000/1000000)e.g. for a canopy with LAI=5 m 2 /m 2 and average LMA=90 g/m 2 , CLM is 4.5 t/ha, approximately half <strong>of</strong> which is carbon.73


