RAINFOR GEM Intensive Plots Manual (pdf) - University of Oxford
RAINFOR GEM Intensive Plots Manual (pdf) - University of Oxford
RAINFOR GEM Intensive Plots Manual (pdf) - University of Oxford
- No tags were found...

Create successful ePaper yourself
Turn your PDF publications into a flip-book with our unique Google optimized e-Paper software.
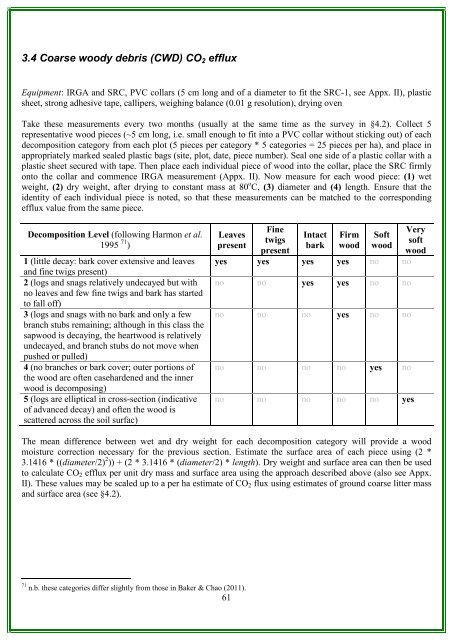
3.4 Coarse woody debris (CWD) CO 2 effluxEquipment: IRGA and SRC, PVC collars (5 cm long and <strong>of</strong> a diameter to fit the SRC-1, see Appx. II), plasticsheet, strong adhesive tape, callipers, weighing balance (0.01 g resolution), drying ovenTake these measurements every two months (usually at the same time as the survey in §4.2). Collect 5representative wood pieces (~5 cm long, i.e. small enough to fit into a PVC collar without sticking out) <strong>of</strong> eachdecomposition category from each plot (5 pieces per category * 5 categories = 25 pieces per ha), and place inappropriately marked sealed plastic bags (site, plot, date, piece number). Seal one side <strong>of</strong> a plastic collar with aplastic sheet secured with tape. Then place each individual piece <strong>of</strong> wood into the collar, place the SRC firmlyonto the collar and commence IRGA measurement (Appx. II). Now measure for each wood piece: (1) wetweight, (2) dry weight, after drying to constant mass at 80 o C, (3) diameter and (4) length. Ensure that theidentity <strong>of</strong> each individual piece is noted, so that these measurements can be matched to the correspondingefflux value from the same piece.Decomposition Level (following Harmon et al.1995 71 )1 (little decay: bark cover extensive and leavesand fine twigs present)2 (logs and snags relatively undecayed but withno leaves and few fine twigs and bark has startedto fall <strong>of</strong>f)3 (logs and snags with no bark and only a fewbranch stubs remaining; although in this class thesapwood is decaying, the heartwood is relativelyundecayed, and branch stubs do not move whenpushed or pulled)4 (no branches or bark cover; outer portions <strong>of</strong>the wood are <strong>of</strong>ten casehardened and the innerwood is decomposing)5 (logs are elliptical in cross-section (indicative<strong>of</strong> advanced decay) and <strong>of</strong>ten the wood isscattered across the soil surfac)LeavespresentFinetwigspresentIntactbarkFirmwoodS<strong>of</strong>twoodyes yes yes yes no nono no yes yes no nono no no yes no nono no no no yes nono no no no no yesVerys<strong>of</strong>twoodThe mean difference between wet and dry weight for each decomposition category will provide a woodmoisture correction necessary for the previous section. Estimate the surface area <strong>of</strong> each piece using (2 *3.1416 * ((diameter/2) 2 )) + (2 * 3.1416 * (diameter/2) * length). Dry weight and surface area can then be usedto calculate CO 2 efflux per unit dry mass and surface area using the approach described above (also see Appx.II). These values may be scaled up to a per ha estimate <strong>of</strong> CO 2 flux using estimates <strong>of</strong> ground coarse litter massand surface area (see §4.2).71 n.b. these categories differ slightly from those in Baker & Chao (2011).61