Primerica 2010 Annual Report - Direct Selling News
Primerica 2010 Annual Report - Direct Selling News
Primerica 2010 Annual Report - Direct Selling News

Create successful ePaper yourself
Turn your PDF publications into a flip-book with our unique Google optimized e-Paper software.
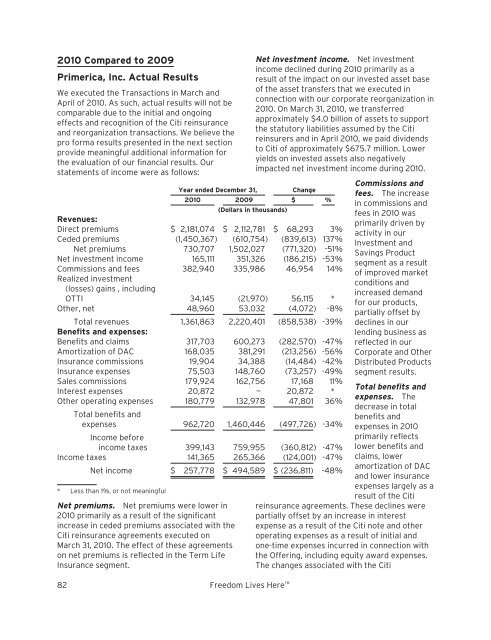
<strong>2010</strong> Compared to 2009<strong>Primerica</strong>, Inc. Actual ResultsWe executed the Transactions in March andApril of <strong>2010</strong>. As such, actual results will not becomparable due to the initial and ongoingeffects and recognition of the Citi reinsuranceand reorganization transactions. We believe thepro forma results presented in the next sectionprovide meaningful additional information forthe evaluation of our financial results. Ourstatements of income were as follows:Year ended December 31,Change<strong>2010</strong> 2009 $ %(Dollars in thousands)Revenues:<strong>Direct</strong> premiums $ 2,181,074 $ 2,112,781 $ 68,293 3%Ceded premiums (1,450,367) (610,754) (839,613) 137%Net premiums 730,707 1,502,027 (771,320) -51%Net investment income 165,111 351,326 (186,215) -53%Commissions and fees 382,940 335,986 46,954 14%Realized investment(losses) gains , includingOTTI 34,145 (21,970) 56,115 *Other, net 48,960 53,032 (4,072) -8%Total revenues 1,361,863 2,220,401 (858,538) -39%Benefits and expenses:Benefits and claims 317,703 600,273 (282,570) -47%Amortization of DAC 168,035 381,291 (213,256) -56%Insurance commissions 19,904 34,388 (14,484) -42%Insurance expenses 75,503 148,760 (73,257) -49%Sales commissions 179,924 162,756 17,168 11%Interest expenses 20,872 — 20,872 *Other operating expenses 180,779 132,978 47,801 36%Total benefits andexpenses 962,720 1,460,446 (497,726) -34%Income beforeincome taxes 399,143 759,955 (360,812) -47%Income taxes 141,365 265,366 (124,001) -47%Net income $ 257,778 $ 494,589 $ (236,811) -48%* Less than 1%, or not meaningfulNet premiums. Net premiums were lower in<strong>2010</strong> primarily as a result of the significantincrease in ceded premiums associated with theCiti reinsurance agreements executed onMarch 31, <strong>2010</strong>. The effect of these agreementson net premiums is reflected in the Term LifeInsurance segment.82 Freedom Lives Here Net investment income. Net investmentincome declined during <strong>2010</strong> primarily as aresult of the impact on our invested asset baseof the asset transfers that we executed inconnection with our corporate reorganization in<strong>2010</strong>. On March 31, <strong>2010</strong>, we transferredapproximately $4.0 billion of assets to supportthe statutory liabilities assumed by the Citireinsurers and in April <strong>2010</strong>, we paid dividendsto Citi of approximately $675.7 million. Loweryields on invested assets also negativelyimpacted net investment income during <strong>2010</strong>.Commissions andfees. The increasein commissions andfees in <strong>2010</strong> wasprimarily driven byactivity in ourInvestment andSavings Productsegment as a resultof improved marketconditions andincreased demandfor our products,partially offset bydeclines in ourlending business asreflected in ourCorporate and OtherDistributed Productssegment results.Total benefits andexpenses. Thedecrease in totalbenefits andexpenses in <strong>2010</strong>primarily reflectslower benefits andclaims, loweramortization of DACand lower insuranceexpenses largely as aresult of the Citireinsurance agreements. These declines werepartially offset by an increase in interestexpense as a result of the Citi note and otheroperating expenses as a result of initial andone-time expenses incurred in connection withthe Offering, including equity award expenses.The changes associated with the Citi