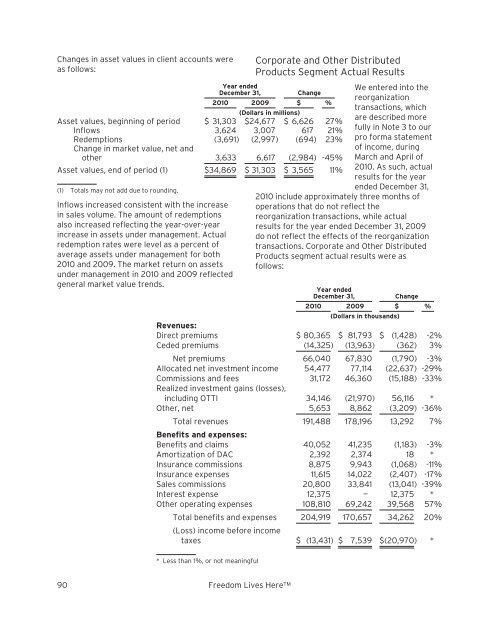
Changes in asset values in client accounts wereas follows:Year endedDecember 31,Change<strong>2010</strong> 2009 $ %(Dollars in millions)Asset values, beginning of period $ 31,303 $24,677 $ 6,626 27%Inflows 3,624 3,007 617 21%Redemptions (3,691) (2,997) (694) 23%Change in market value, net andother 3,633 6,617 (2,984) -45%Asset values, end of period (1) $34,869 $ 31,303 $ 3,565 11%(1) Totals may not add due to rounding.Inflows increased consistent with the increasein sales volume. The amount of redemptionsalso increased reflecting the year-over-yearincrease in assets under management. Actualredemption rates were level as a percent ofaverage assets under management for both<strong>2010</strong> and 2009. The market return on assetsunder management in <strong>2010</strong> and 2009 reflectedgeneral market value trends.Corporate and Other DistributedProducts Segment Actual ResultsWe entered into thereorganizationtransactions, whichare described morefully in Note 3 to ourpro forma statementof income, duringMarch and April of<strong>2010</strong>. As such, actualresults for the yearended December 31,<strong>2010</strong> include approximately three months ofoperations that do not reflect thereorganization transactions, while actualresults for the year ended December 31, 2009do not reflect the effects of the reorganizationtransactions. Corporate and Other DistributedProducts segment actual results were asfollows:Year endedDecember 31,Change<strong>2010</strong> 2009 $ %(Dollars in thousands)Revenues:<strong>Direct</strong> premiums $ 80,365 $ 81,793 $ (1,428) -2%Ceded premiums (14,325) (13,963) (362) 3%Net premiums 66,040 67,830 (1,790) -3%Allocated net investment income 54,477 77,114 (22,637) -29%Commissions and fees 31,172 46,360 (15,188) -33%Realized investment gains (losses),including OTTI 34,146 (21,970) 56,116 *Other, net 5,653 8,862 (3,209) -36%Total revenues 191,488 178,196 13,292 7%Benefits and expenses:Benefits and claims 40,052 41,235 (1,183) -3%Amortization of DAC 2,392 2,374 18 *Insurance commissions 8,875 9,943 (1,068) -11%Insurance expenses 11,615 14,022 (2,407) -17%Sales commissions 20,800 33,841 (13,041) -39%Interest expense 12,375 — 12,375 *Other operating expenses 108,810 69,242 39,568 57%Total benefits and expenses 204,919 170,657 34,262 20%(Loss) income before incometaxes $ (13,431) $ 7,539 $(20,970) ** Less than 1%, or not meaningful90 Freedom Lives Here TM
We believe that the pro forma results presentedbelow provide meaningful additionalinformation necessary to evaluate our segmentfinancial results.Corporate and Other DistributedProducts Segment Pro Forma ResultsCorporate and Other Distributed Productssegment pro forma results give effect to thereorganization transactions, which aredescribed more fully in Note 3 to our pro formastatement of income. On a pro forma basis,Corporate and Other Distributed Productssegment results were as follows:Total revenues increased in <strong>2010</strong> primarily as aresult of recognizing realized investment gainsin <strong>2010</strong> versus impairment losses in 2009. Thisgrowth was partially offset by lowercommissions and fees as a result of thecontinuing decline in our lending business. Theincrease in total revenues was also partiallyoffset by lower net investment income and adecline in our print business as reflected inother, net. Realized investment gains (losses)included $12.2 million of OTTI in <strong>2010</strong>,compared with $61.4 million of OTTI in 2009.Total benefits and expenses were lower in <strong>2010</strong>primarily as a result of lower sales commissionsYear endedDecember 31, Change<strong>2010</strong> 2009 $ %(Dollars in thousands)Revenues:<strong>Direct</strong> premiums $ 80,365 $ 81,793 $ (1,428) -2%Ceded premiums (14,325) (13,963) (362) 3%Total premiums 66,040 67,830 (1,790) -3%Allocated net investment income 48,081 50,043 (1,962) -4%Commissions and fees 31,172 46,360 (15,188) -33%Realized investment gains (losses),including OTTI 34,146 (21,970) 56,116 *Other, net 5,653 8,862 (3,209) -36%Total revenues 185,092 151,125 33,967 22%Benefits and expenses:Benefits and claims 40,052 41,235 (1,183) -3%Amortization of DAC 2,392 2,374 18 1%Insurance commissions 8,875 9,943 (1,068) -11%Insurance expenses 11,615 14,022 (2,407) -17%Sales commissions 20,800 33,841 (13,041) -39%Interest expense 16,500 16,500 — *Other operating expenses 111,886 104,012 7,874 8%Total benefits and expenses 212,120 221,927 (9,807) -4%Loss before income taxes $(27,028)$(70,802)$43,774 -62%partially offset by anincrease in otheroperating expenses.Sales commissionsexpense was lower in<strong>2010</strong> consistent withthe decline incommissions andfees revenue notedabove. Otheroperating expensesincreased primarilyas a result of publiccompany andIPO-related expensesincurred in <strong>2010</strong>.For additionalsegmentinformation, seeNote 3 to ourconsolidated andcombined financialstatements.* Less than 1%, or not meaningful<strong>Primerica</strong> <strong>2010</strong> <strong>Annual</strong> <strong>Report</strong> 91
- Page 1 and 2:
Freedom Lives Here 2010 Annual Repo
- Page 3 and 4:
A Main Street Company for Main Stre
- Page 5 and 6:
North America’s vastmiddle-income
- Page 7 and 8:
More than 50 percent of U.S. househ
- Page 9 and 10:
We are PrimericaPrimerica is a Main
- Page 11 and 12:
Primerica helps familiescreate a fi
- Page 13 and 14:
René Turner wasalways told growing
- Page 15 and 16:
We teach people how money works.We
- Page 19 and 20:
UNITED STATESSECURITIES AND EXCHANG
- Page 21 and 22:
CAUTIONARY STATEMENT CONCERNING FOR
- Page 23 and 24:
PART IITEM 1.BUSINESSOverviewPrimer
- Page 25 and 26:
them reduce and ultimately pay off
- Page 27 and 28:
With the support of our home office
- Page 29 and 30:
ecognized with the sales representa
- Page 31 and 32:
force. We also profile successful s
- Page 33 and 34:
• bonuses and other compensation,
- Page 35 and 36:
originators (and in some states as
- Page 37 and 38:
We organize and manage our business
- Page 39 and 40:
premiums that are less per person p
- Page 41 and 42:
insurance policies that we underwri
- Page 43 and 44:
assistance, has developed a series
- Page 45 and 46:
SEC, FINRA and with respect to 529
- Page 47 and 48:
they sell insurance policies. Our C
- Page 49 and 50:
preceding 12 months, exceed this st
- Page 51 and 52:
interest rate risk and business ris
- Page 53 and 54:
operational support to its subsidia
- Page 55 and 56:
Privacy of Consumer Information. U.
- Page 57 and 58:
media. This negative commentary can
- Page 59 and 60: with such laws and regulations, inc
- Page 61 and 62: and disrupt the economy. Although w
- Page 63 and 64: Our financial strength and credit r
- Page 65 and 66: There are certain risks and uncerta
- Page 67 and 68: 26). The update revises the definit
- Page 69 and 70: conduct standards prescribed by FIN
- Page 71 and 72: licensing requirements have caused,
- Page 73 and 74: Terrorist Financing Act and its acc
- Page 75 and 76: educing dividends or other amounts
- Page 77 and 78: housed at our Duluth and Roswell, G
- Page 79 and 80: • for dates as of or periods endi
- Page 81 and 82: to and subject to the limitations o
- Page 83 and 84: Field Audit Department from 1993 to
- Page 85 and 86: Securities Authorized for Issuanceu
- Page 87 and 88: ITEM 6.SELECTED FINANCIAL DATA.The
- Page 89 and 90: pursuant to which we issued to a wh
- Page 91 and 92: ecruiting boost we experienced in t
- Page 93 and 94: • Mortality. We use historical ex
- Page 95 and 96: • sales of a higher proportion of
- Page 97 and 98: on quality rating, average life and
- Page 99 and 100: Deferred Policy Acquisition Costs(D
- Page 101 and 102: life insurance processing responsib
- Page 103 and 104: einsurance agreements impacted the
- Page 105 and 106: Notes to the Pro Forma Statement of
- Page 107 and 108: Term Life Insurance Segment ProForm
- Page 109: Investments and Savings ProductsSeg
- Page 113 and 114: ecognized in 2008. Excluding the ef
- Page 115 and 116: amortize the higher DAC balance res
- Page 117 and 118: Corporate and Other DistributedProd
- Page 119 and 120: The composition of our invested ass
- Page 121 and 122: LIQUIDITY AND CAPITALRESOURCESDivid
- Page 123 and 124: surplus notes, hybrid securities or
- Page 125 and 126: ITEM 7A. QUANTITATIVE ANDQUALITATIV
- Page 127 and 128: AssetsPRIMERICA, INC. AND SUBSIDIAR
- Page 129 and 130: PRIMERICA, INC. AND SUBSIDIARIESCon
- Page 131 and 132: PRIMERICA, INC. AND SUBSIDIARIESCon
- Page 133 and 134: which we are able to reinvest at ou
- Page 135 and 136: with reinsured policies. Ceded poli
- Page 137 and 138: indemnify and hold the Company harm
- Page 139 and 140: New Accounting PrinciplesScope Exce
- Page 141 and 142: immediately contributed back to us
- Page 143 and 144: The Investment and Savings Products
- Page 145 and 146: (4) InvestmentsOn March 31, 2010, w
- Page 147 and 148: The following tables summarize, for
- Page 149 and 150: The net effect on stockholders’ e
- Page 151 and 152: The amortized cost and fair value o
- Page 153 and 154: The roll-forward of credit-related
- Page 155 and 156: having similar tenors (e.g., sector
- Page 157 and 158: (5) Financial InstrumentsThe carryi
- Page 159 and 160: Due from reinsurers includes ceded
- Page 161 and 162:
(8) Intangible Assets and GoodwillT
- Page 163 and 164:
(11) Note PayableIn April 2010, we
- Page 165 and 166:
Income tax expense (benefit) attrib
- Page 167 and 168:
above, plus an additional 7,098 com
- Page 169 and 170:
Non-Employee Share-BasedTransaction
- Page 171 and 172:
We had arrangements with Citi in re
- Page 173 and 174:
Contingent LiabilitiesThe Company i
- Page 175 and 176:
ITEM 9. CHANGES IN ANDDISAGREEMENTS
- Page 177 and 178:
Members of Our Board of DirectorsTh
- Page 179 and 180:
finance, and risk and asset managem
- Page 181 and 182:
PART IVITEM 15. EXHIBITS AND FINANC
- Page 183 and 184:
10.4 Long-Term Services Agreement d
- Page 185 and 186:
10.29 Employment Agreement, dated a
- Page 187 and 188:
Schedule ISummary of Investments
- Page 189 and 190:
Schedule IICondensed Financial Info
- Page 191 and 192:
Schedule IICondensed Financial Info
- Page 193 and 194:
101% of the outstanding principal a
- Page 195 and 196:
GrossamountSchedule IVReinsurancePR
- Page 197 and 198:
Annual MeetingThe annual meeting of