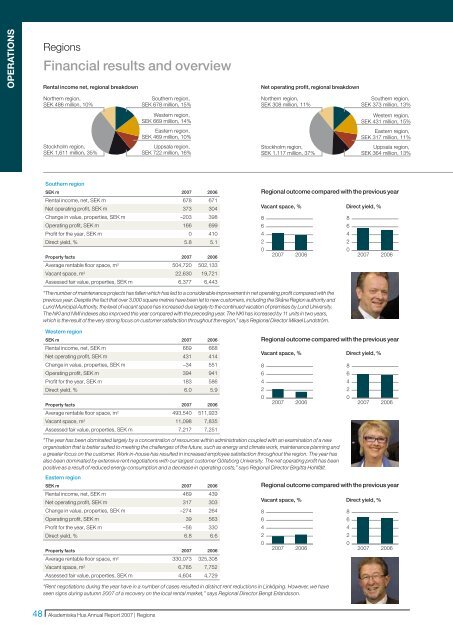
OPERATIONSRegionsFinancial results and overviewRental income net, regional breakdownNet operating profit, regional breakdownNorthern region,SEK 486 million, 10%Southern region,SEK 678 million, 15%Northern region,SEK 308 million, 11%Southern region,SEK 373 million, 13%Western region,SEK 669 million, 14%Western region,SEK 431 million, 15%Eastern region,SEK 469 million, 10%Eastern region,SEK 317 million, 11%Stockholm region,SEK 1,611 million, 35%Uppsala region,SEK 722 million, 16%Stockholm region,SEK 1,117 million, 37%Uppsala region,SEK 364 million, 13%Southern regionSEK m 2007 2006Rental income, net, SEK m 678 671Net operating profit, SEK m 373 304Change in value, properties, SEK m –203 398Operating profit, SEK m 166 699Profit for the year, SEK m 0 410Direct yield, % 5.8 5.1Property facts 2007 2006Average rentable floor space, m 2 504,720 502,133Vacant space, m 2 22,630 19,721Assessed fair value, properties, SEK m 6,377 6,443Regional outcome compared with the previous yearVacant space, % Direct yield, %88664422002007 20062007 2006“The number of maintenance projects has fallen which has led to a considerable improvement in net operating profit compared with theprevious year. Despite the fact that over 3,000 square metres have been let to new customers, including the Skåne Region authority andLund Municipal Authority, the level of vacant space has increased due largely to the continued vacation of premises by Lund University.The NKI and NMI indexes also improved this year compared with the preceding year. The NKI has increased by 11 units in two years,which is the result of the very strong focus on customer satisfaction throughout the region,” says Regional Director Mikael Lundström.Western regionSEK m 2007 2006Rental income, net, SEK m 669 668Net operating profit, SEK m 431 414Change in value, properties, SEK m –34 551Operating profit, SEK m 394 941Profit for the year, SEK m 183 586Direct yield, % 6.0 5.9Property facts 2007 2006Average rentable floor space, m 2 493,540 511,923Vacant space, m 2 11,098 7,835Assessed fair value, properties, SEK m 7,217 7,251Regional outcome compared with the previous yearVacant space, % Direct yield, %88664422002007 20062007 2006”The year has been dominated largely by a concentration of resources within administration coupled with an examination of a neworganisation that is better suited to meeting the challenges of the future, such as energy and climate work, maintenance planning anda greater focus on the customer. Work in-house has resulted in increased employee satisfaction throughout the region. The year hasalso been dominated by extensive rent negotiations with our largest customer Göteborg University. The net operating profit has beenpositive as a result of reduced energy consumption and a decrease in operating costs,” says Regional Director Birgitta Hohlfält.Eastern regionSEK m 2007 2006Rental income, net, SEK m 469 439Net operating profit, SEK m 317 303Change in value, properties, SEK m –274 264Operating profit, SEK m 39 563Profit for the year, SEK m –56 330Direct yield, % 6.8 6.6Property facts 2007 2006Average rentable floor space, m 2 330,073 325,308Vacant space, m 2 6,785 7,752Assessed fair value, properties, SEK m 4,604 4,729Regional outcome compared with the previous yearVacant space, % Direct yield, %88664422002007 20062007 2006“Rent negotiations during the year have in a number of cases resulted in distinct rent reductions in Linköping. However, we haveseen signs during autumn 2007 of a recovery on the local rental market,” says Regional Director Bengt Erlandsson.48 <strong>Akademiska</strong> <strong>Hus</strong> <strong>Annual</strong> <strong>Report</strong> 2007 | Regions
Average rentable floor space, regional breakdownVacant space, regional breakdownNorthern region,408,082 m 2 , 13%Southern region,504,720 m 2 , 16%Northern region,8,172 m 2 , 8%Southern region,22,630 m 2 , 23%Western region,493,540 m 2 , 15%Eastern region,330,073 m 2 , 10%Stockholm region,29,468 m 2 , 30%Western region,11,098 m 2 , 11%Stockholm region,935,777 m 2 , 29%Uppsala region,549,605 m 2 , 17%Uppsala region,21,002 m 2 , 21%Eastern region,6,785 m 2 , 7%Uppsala RegionSEK m 2007 2006Rental income, net, SEK m 722 723Net operating profit, SEK m 364 446Change in value, properties, SEK m 42 153Operating profit, SEK m 399 592Profit for the year, SEK m 196 311Direct yield, % 5.8 7.3Property facts 2007 2006Average rentable floor space, m 2 549,605 561,532Vacant space, m 2 21,002 33,192Assessed fair value, properties, SEK m 6,334 6,170Regional outcome compared with the previous yearVacant space, % Direct yield, %88664422002007 20062007 2006“Both the region’s universities have worked to improve the efficiency of their use of floor space. This has led to leases being terminated.During the operating year a number of these premises have been adapted and have acquired new customers outsidethe university sector. Extensive investments are planned over the next five-seven years,” says Regional Director Hans Antonsson.Stockholm RegionSEK m 2007 2006Rental income, net, SEK m 1 611 1 582Net operating profit, SEK m 1 117 1 091Change in value, properties, SEK m –11 410Operating profit, SEK m 1 101 1 481Profit for the year, SEK m 495 768Direct yield, % 5.7 5.6Property facts 2007 2006Average rentable floor space, m 2 935,777 948,745Vacant space, m 2 29,468 34,126Assessed fair value, properties, SEK m 19,571 19,671Regional outcome compared with the previous yearVacant space, % Direct yield, %88664422002007 20062007 2006“The region’s net operating profit for 2007 is on a par with 2006 despite the fact that the property holdings have fallen as result of acouple of customers vacating premises. During 2007, the level of investment continued to be high and at the same time the task ofdeveloping new building rights in Stockholm and Solna has been intensified. The region reinforced its NKI during the year to 69,which is an increase of three units and at the same time our NMI increased to 71, which is also an increase of three units comparedwith the previous year,” says Regional Director Lennart Karlsson.Northern RegionSEK m 2007 2006Rental income, net, SEK m 486 461Net operating profit, SEK m 308 275Change in value, properties, SEK m –136 98Operating profit, SEK m 169 372Profit for the year, SEK m 54 205Direct yield, % 7.3 6.8Property facts 2007 2006Average rentable floor space, m 2 408,082 399,311Vacant space, m 2 8,172 9,329Assessed fair value, properties, SEK m 4,264 4,190Regional outcome compared with the previous yearVacant space, % Direct yield, %88664422002007 20062007 2006“The good results are expected to continue due to the solid work being done by the employees with an increase in the NKI, focusedenergy optimisation and more efficient management. By reason of the fall in investment volume and changes in demand at a coupleof locations, structural changes within the region have commenced. The Härnösand Campus will be divested during 2008 and conversionsfor new customers will take place in Luleå and Sundsvall in 2008–2009,” says Regional Director Mattias Lindberg.<strong>Akademiska</strong> <strong>Hus</strong> <strong>Annual</strong> <strong>Report</strong> 2007 | Regions 49
- Page 6 and 7: Review of the yearAkademiska Hus 20
- Page 8 and 9: Statement by the PresidentIncreased
- Page 10 and 11: Business concept, visions and objec
- Page 12 and 13: MARKETRental and property marketGoo
- Page 14 and 15: MARKETAkademiska Hus marketHigher e
- Page 16 and 17: MARKETResearch Bill 2008In internat
- Page 18 and 19: MARKETCompetitorsLocal players the
- Page 20 and 21: MARKETProperty specification, North
- Page 23 and 24: 1613 6 24 2912171142962122932464751
- Page 25 and 26: EASTERN REGION (ÖST)Major efforts
- Page 27 and 28: ((KYRKBYNE6E20GOTHENBURGSA-FÄRJEST
- Page 29 and 30: LLUNDPLANTAGELYCKANHELGONAGÅRDEN3S
- Page 31 and 32: At the Ingvar Kamprad Design Centre
- Page 33 and 34: could benefit from proximity to the
- Page 35 and 36: of energy system and form of energy
- Page 37 and 38: difficult to influence. In the Ultu
- Page 40 and 41: OPERATIONSProperty valuationSlight
- Page 42: OPERATIONSlation of the rental paym
- Page 45 and 46: Operating costsOperating costs, a s
- Page 47 and 48: Maintenance costsStable maintenance
- Page 49 and 50: Comments on the Five-year summary1.
- Page 51: Regions and GroupKey figuresKey fig
- Page 55 and 56: Interest-bearing net loan debt, inc
- Page 57 and 58: Construction projectsNew constructi
- Page 59 and 60: By drawing up good documents for co
- Page 61 and 62: Akademiska Hus - a partner in the d
- Page 63 and 64: SustainabilityAkademiska Hus’s am
- Page 65 and 66: Akademiska Hus is working to ensure
- Page 67 and 68: EmployeesInvestment in employee dev
- Page 69 and 70: Group level, on the regional level
- Page 71 and 72: Group corporate governance reportTh
- Page 73 and 74: Remuneration and other terms and co
- Page 75 and 76: Board and auditorsBOARDEva-Britt Gu
- Page 77 and 78: Financial Report 73-10473Swedish Na
- Page 79 and 80: Income StatementsGroupIFRSParent Co
- Page 81 and 82: Balance SheetsGroupIFRSParent Compa
- Page 83 and 84: Cash Flow StatementsGroupIFRSParent
- Page 85 and 86: Note 3, cont’d .comprises rental
- Page 87 and 88: Note 3, cont’d .fair value. Chang
- Page 89 and 90: 6 Categorised operating costsFuncti
- Page 91 and 92: Note 13, cont’d .Payments to the
- Page 93 and 94: Note 17, cont’d.17 TaxesThe follo
- Page 95 and 96: Cost of capital and direct yield re
- Page 97 and 98: Note 24, cont’d.The table below s
- Page 99 and 100: Note 32, cont’d.Borrowing can be
- Page 101 and 102: Note 33, cont’d.The retirement pe
- Page 103 and 104:
Note 37, cont’d.Due date structur
- Page 105 and 106:
39 Pledged assetsGroupIFRSParent Co
- Page 107 and 108:
Audit ReportTo the annual meeting o
- Page 109 and 110:
AddressesGROUP HEAD OFFICEAkademisk