Financial <strong>Report</strong>28 Prepaid expenses and accrued incomeGroupIFRSParent Company<strong>Annual</strong> Accounts Act31-12-2007 31-12-2006 31-12-2007 31-12-2006Accrued rent 32,456 15,557 – –Prepaid rental income 1,884 2,795 – –Accrued interestincome 4,058 1,043 1,058 1,043Prepaid interestexpense 290 290 290 290Prepaid energy costs 15,887 22,717 – –Miscellaneous 76,583 60,058 33,070 28,957Total 131,158 102,460 34,418 30,29030 Liquid fundsCurrent investments mainly comprise temporary surplus liquidity investedin the day loan market and collateral granted attributable to the credit supportannexes (CSA). At the turn of the year the Group had granted collateralthrough CSA agreements of KSEK 220,500 (275,250). Blocked bank funds inrespect of pledged assets for stock market-cleared derivatives are includedto the amount of KSEK 39,035 (44,562) in the reported amount for cash andbank balances for the Group and the Parent Company.Liquid funds according to the Cash Flow Statement concur with liquidfunds in the Balance Sheet.GroupIFRSParent Company<strong>Annual</strong> Accounts Act31-12-2007 31-12-2006 31-12-2007 31-12-2006Cash and bank holdings 46,232 563,563 45,779 563,507Current investments 797,601 815,250 797,601 815,250Total 843,833 1,378,813 843,380 1,378,75729 Due date structure, receivablesDue date structureGroupIFRSParent Company<strong>Annual</strong> Accounts Act31-12-2007 31-12-2006 31-12-2007 31-12-2006Receivables expectedto be cleared within oneyear of the year-end 677,237 845,160 21,942,419 20,845,685Receivables expectedto be cleared within 1–5years of the year-end 542,170 600,861 200,286 228,740Receivables expectedto be cleared later thanfive years after theyear-end 366,395 297,659 204,668 189,302Total 1,585,802 1,743,680 22,347,373 21,263,72732 LoansThe Group’s financing takes place mainly through borrowing via four publicfinancing programmes. Through their standardised terms and conditions thesepermit rational, cost-effective financing. The Group has a domestic commercialpaper programme, an MTM programme and international ECP and EMTNprogrammes. Bank financing is used to a limited extent. The average capitalfor bank financing during 2007 was SEK 253 million (315).The Group risk management is presented in Note 37 Financial riskmanagement.Financing costThe net interest income and expense amounted to SEK –610 million (–419)and the average liability portfolio was SEK 16,913 (16,773). The financing costamounted to 3.63 per cent (2.48) calculated as the interest expense in relationto average interest-bearing net loan liability, excluding cash and bank holdings,according to IFRS. On December 31, 2007 the average rate of intereston the outstanding liability portfolio was 4.41 per cent (3.35), excluding interestderivatives, and 4.54 (4.21) per cent including interest derivatives.Liquid funds are reported and valued according to the category assets valuedat fair value in profit and loss. Fair value is equivalent to the reported value ofcash and bank holdings and current investments.31 Hedge reserve/Fair value reserveGroupIFRSParent Company<strong>Annual</strong> Accounts Act31-12-2007 31-12-2006 31-12-2007 31-12-2006Opening balance 1,842 33,636 1,842 33,636Change in value,derivative instrument(cash flow hedging)– exchange rateinterest swap – –115 – –115– currency derivatives 9,979 –6,008 9,979 –6,008– electricity derivatives 50,210 –9,111 50,210 –9,111Transferred to netfinancial income/expense 354 92 354 92Transferred to theoperating result 2,312 –29,014 2,312 –29,014Tax effect –17,598 12,362 –17,598 12,362Closing balance 47,099 1,842 47,099 1,842Financing cost, %2003 2004 2005 2006 2007Financing cost for loans 3.97 3.05 2.62 2.81 3.80Net interest income/expense, interest rate swaps 0.90 1.20 1.05 0.93 0.45Allocations to specific periods and charges 0.43 0.25 0.03 0.02 0.01Changes in value, financial instruments according to IFRS – – 0.15 –1.28 –0.63Total financing cost 5.30 4.50 3.85 2.48 3.6394 <strong>Akademiska</strong> <strong>Hus</strong> <strong>Annual</strong> <strong>Report</strong> 2007 | Notes
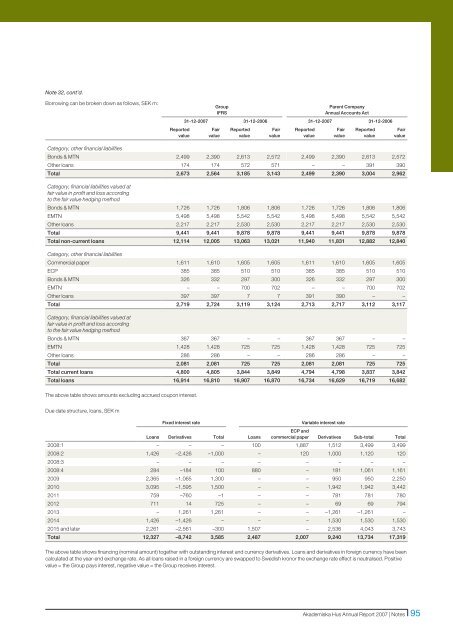
Note 32, cont’d.Borrowing can be broken down as follows, SEK m:<strong>Report</strong>edvalueGroupIFRSParent Company<strong>Annual</strong> Accounts Act31-12-2007 31-12-2006 31-12-2007 31-12-2006Fairvalue<strong>Report</strong>edvalueFairvalue<strong>Report</strong>edvalueFairvalue<strong>Report</strong>edvalueFairvalueCategory, other financial liabilitiesBonds & MTN 2,499 2,390 2,613 2,572 2,499 2,390 2,613 2,572Other loans 174 174 572 571 – – 391 390Total 2,673 2,564 3,185 3,143 2,499 2,390 3,004 2,962Category, financial liabilities valued atfair value in profit and loss accordingto the fair value hedging methodBonds & MTN 1,726 1,726 1,806 1,806 1,726 1,726 1,806 1,806EMTN 5,498 5,498 5,542 5,542 5,498 5,498 5,542 5,542Other loans 2,217 2,217 2,530 2,530 2,217 2,217 2,530 2,530Total 9,441 9,441 9,878 9,878 9,441 9,441 9,878 9,878Total non-current loans 12,114 12,005 13,063 13,021 11,940 11,831 12,882 12,840Category, other financial liabilitiesCommercial paper 1,611 1,610 1,605 1,605 1,611 1,610 1,605 1,605ECP 385 385 510 510 385 385 510 510Bonds & MTN 326 332 297 300 326 332 297 300EMTN – – 700 702 – – 700 702Other loans 397 397 7 7 391 390 – –Total 2,719 2,724 3,119 3,124 2,713 2,717 3,112 3,117Category, financial liabilities valued atfair value in profit and loss accordingto the fair value hedging methodBonds & MTN 367 367 – – 367 367 – –EMTN 1,428 1,428 725 725 1,428 1,428 725 725Other loans 286 286 – – 286 286 – –Total 2,081 2,081 725 725 2,081 2,081 725 725Total current loans 4,800 4,805 3,844 3,849 4,794 4,798 3,837 3,842Total loans 16,914 16,810 16,907 16,870 16,734 16,629 16,719 16,682The above table shows amounts excluding accrued coupon interest.Due date structure, loans, SEK mFixed interest rateLoans Derivatives Total LoansVariable interest rateECP andcommercial paper Derivatives Sub-total Total2008:1 – – – 100 1,887 1,512 3,499 3,4992008:2 1,426 –2,426 –1,000 – 120 1,000 1,120 1202008:3 – – – – – – – –2008:4 284 –184 100 880 – 181 1,061 1,1612009 2,365 –1,065 1,300 – – 950 950 2,2502010 3,095 –1,595 1,500 – – 1,942 1,942 3,4422011 759 –760 –1 – – 781 781 7802012 711 14 725 – – 69 69 7942013 – 1,261 1,261 – – –1,261 –1,261 –2014 1,426 –1,426 – – – 1,530 1,530 1,5302015 and later 2,261 –2,561 –300 1,507 – 2,536 4,043 3,743Total 12,327 –8,742 3,585 2,487 2,007 9,240 13,734 17,319The above table shows financing (nominal amount) together with outstanding interest and currency derivatives. Loans and derivatives in foreign currency have beencalculated at the year-end exchange rate. As all loans raised in a foreign currency are swapped to Swedish kronor the exchange rate effect is neutralised. Positivevalue = the Group pays interest, negative value = the Group receives interest.<strong>Akademiska</strong> <strong>Hus</strong> <strong>Annual</strong> <strong>Report</strong> 2007 | Notes 95
- Page 6 and 7:
Review of the yearAkademiska Hus 20
- Page 8 and 9:
Statement by the PresidentIncreased
- Page 10 and 11:
Business concept, visions and objec
- Page 12 and 13:
MARKETRental and property marketGoo
- Page 14 and 15:
MARKETAkademiska Hus marketHigher e
- Page 16 and 17:
MARKETResearch Bill 2008In internat
- Page 18 and 19:
MARKETCompetitorsLocal players the
- Page 20 and 21:
MARKETProperty specification, North
- Page 23 and 24:
1613 6 24 2912171142962122932464751
- Page 25 and 26:
EASTERN REGION (ÖST)Major efforts
- Page 27 and 28:
((KYRKBYNE6E20GOTHENBURGSA-FÄRJEST
- Page 29 and 30:
LLUNDPLANTAGELYCKANHELGONAGÅRDEN3S
- Page 31 and 32:
At the Ingvar Kamprad Design Centre
- Page 33 and 34:
could benefit from proximity to the
- Page 35 and 36:
of energy system and form of energy
- Page 37 and 38:
difficult to influence. In the Ultu
- Page 40 and 41:
OPERATIONSProperty valuationSlight
- Page 42:
OPERATIONSlation of the rental paym
- Page 45 and 46:
Operating costsOperating costs, a s
- Page 47 and 48: Maintenance costsStable maintenance
- Page 49 and 50: Comments on the Five-year summary1.
- Page 51 and 52: Regions and GroupKey figuresKey fig
- Page 53 and 54: Average rentable floor space, regio
- Page 55 and 56: Interest-bearing net loan debt, inc
- Page 57 and 58: Construction projectsNew constructi
- Page 59 and 60: By drawing up good documents for co
- Page 61 and 62: Akademiska Hus - a partner in the d
- Page 63 and 64: SustainabilityAkademiska Hus’s am
- Page 65 and 66: Akademiska Hus is working to ensure
- Page 67 and 68: EmployeesInvestment in employee dev
- Page 69 and 70: Group level, on the regional level
- Page 71 and 72: Group corporate governance reportTh
- Page 73 and 74: Remuneration and other terms and co
- Page 75 and 76: Board and auditorsBOARDEva-Britt Gu
- Page 77 and 78: Financial Report 73-10473Swedish Na
- Page 79 and 80: Income StatementsGroupIFRSParent Co
- Page 81 and 82: Balance SheetsGroupIFRSParent Compa
- Page 83 and 84: Cash Flow StatementsGroupIFRSParent
- Page 85 and 86: Note 3, cont’d .comprises rental
- Page 87 and 88: Note 3, cont’d .fair value. Chang
- Page 89 and 90: 6 Categorised operating costsFuncti
- Page 91 and 92: Note 13, cont’d .Payments to the
- Page 93 and 94: Note 17, cont’d.17 TaxesThe follo
- Page 95 and 96: Cost of capital and direct yield re
- Page 97: Note 24, cont’d.The table below s
- Page 101 and 102: Note 33, cont’d.The retirement pe
- Page 103 and 104: Note 37, cont’d.Due date structur
- Page 105 and 106: 39 Pledged assetsGroupIFRSParent Co
- Page 107 and 108: Audit ReportTo the annual meeting o
- Page 109 and 110: AddressesGROUP HEAD OFFICEAkademisk