

REPORT ON THE ANA OF 2014
REPORT ON THE ANA OF 2014
REPORT ON THE ANA OF 2014
- No tags were found...

Create successful ePaper yourself
Turn your PDF publications into a flip-book with our unique Google optimized e-Paper software.
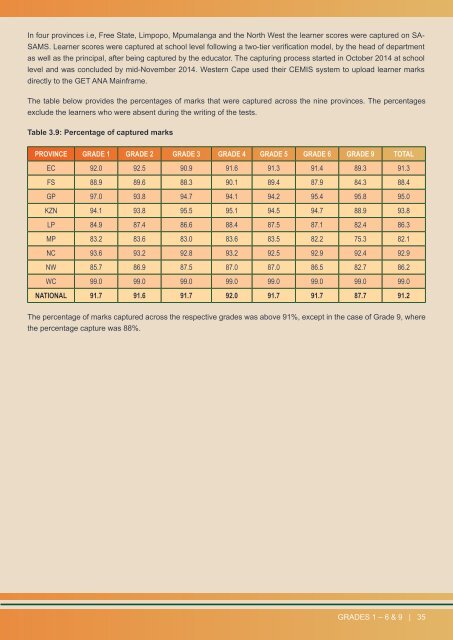
In four provinces i.e, Free State, Limpopo, Mpumalanga and the North West the learner scores were captured on SA-SAMS. Learner scores were captured at school level following a two-tier verification model, by the head of departmentas well as the principal, after being captured by the educator. The capturing process started in October <strong>2014</strong> at schoollevel and was concluded by mid-November <strong>2014</strong>. Western Cape used their CEMIS system to upload learner marksdirectly to the GET <strong>ANA</strong> Mainframe.The table below provides the percentages of marks that were captured across the nine provinces. The percentagesexclude the learners who were absent during the writing of the tests.Table 3.9: Percentage of captured marksPROVINCE GRADE 1 GRADE 2 GRADE 3 GRADE 4 GRADE 5 GRADE 6 GRADE 9 TOTALEC 92.0 92.5 90.9 91.6 91.3 91.4 89.3 91.3FS 88.9 89.6 88.3 90.1 89.4 87.9 84.3 88.4GP 97.0 93.8 94.7 94.1 94.2 95.4 95.8 95.0KZN 94.1 93.8 95.5 95.1 94.5 94.7 88.9 93.8LP 84.9 87.4 86.6 88.4 87.5 87.1 82.4 86.3MP 83.2 83.6 83.0 83.6 83.5 82.2 75.3 82.1NC 93.6 93.2 92.8 93.2 92.5 92.9 92.4 92.9NW 85.7 86.9 87.5 87.0 87.0 86.5 82.7 86.2WC 99.0 99.0 99.0 99.0 99.0 99.0 99.0 99.0NATI<strong>ON</strong>AL 91.7 91.6 91.7 92.0 91.7 91.7 87.7 91.2The percentage of marks captured across the respective grades was above 91%, except in the case of Grade 9, wherethe percentage capture was 88%.GRADES 1 – 6 & 9 | 35