

REPORT ON THE ANA OF 2014
REPORT ON THE ANA OF 2014
REPORT ON THE ANA OF 2014
- No tags were found...

Create successful ePaper yourself
Turn your PDF publications into a flip-book with our unique Google optimized e-Paper software.
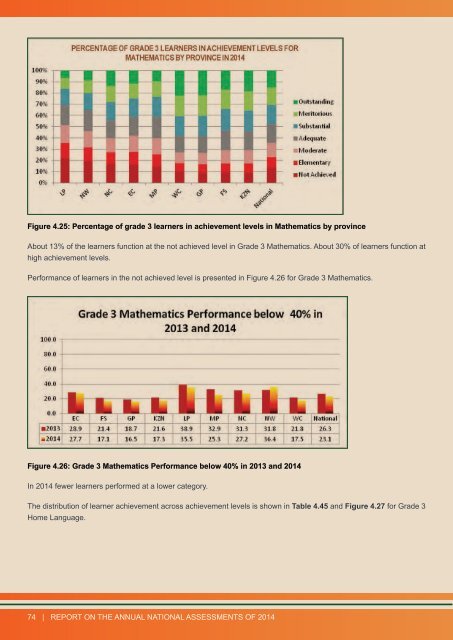
Figure 4.25: Percentage of grade 3 learners in achievement levels in Mathematics by provinceAbout 13% of the learners function at the not achieved level in Grade 3 Mathematics. About 30% of learners function athigh achievement levels.Performance of learners in the not achieved level is presented in Figure 4.26 for Grade 3 Mathematics.Figure 4.26: Grade 3 Mathematics Performance below 40% in 2013 and <strong>2014</strong>In <strong>2014</strong> fewer learners performed at a lower category.The distribution of learner achievement across achievement levels is shown in Table 4.45 and Figure 4.27 for Grade 3Home Language.74 | <strong>REPORT</strong> <strong>ON</strong> <strong>THE</strong> ANNUAL NATI<strong>ON</strong>AL ASSESSMENTS <strong>OF</strong> <strong>2014</strong>