

REPORT ON THE ANA OF 2014
REPORT ON THE ANA OF 2014
REPORT ON THE ANA OF 2014
- No tags were found...

You also want an ePaper? Increase the reach of your titles
YUMPU automatically turns print PDFs into web optimized ePapers that Google loves.
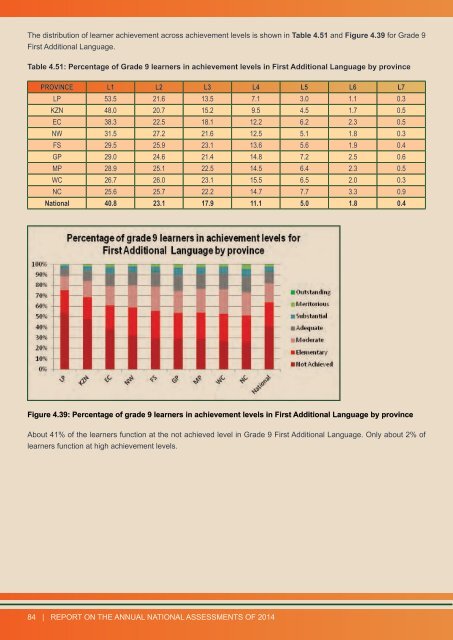
The distribution of learner achievement across achievement levels is shown in Table 4.51 and Figure 4.39 for Grade 9First Additional Language.Table 4.51: Percentage of Grade 9 learners in achievement levels in First Additional Language by provincePROVINCE L1 L2 L3 L4 L5 L6 L7LP 53.5 21.6 13.5 7.1 3.0 1.1 0.3KZN 48.0 20.7 15.2 9.5 4.5 1.7 0.5EC 38.3 22.5 18.1 12.2 6.2 2.3 0.5NW 31.5 27.2 21.6 12.5 5.1 1.8 0.3FS 29.5 25.9 23.1 13.6 5.6 1.9 0.4GP 29.0 24.6 21.4 14.8 7.2 2.5 0.6MP 28.9 25.1 22.5 14.5 6.4 2.3 0.5WC 26.7 26.0 23.1 15.5 6.5 2.0 0.3NC 25.6 25.7 22.2 14.7 7.7 3.3 0.9National 40.8 23.1 17.9 11.1 5.0 1.8 0.4Figure 4.39: Percentage of grade 9 learners in achievement levels in First Additional Language by provinceAbout 41% of the learners function at the not achieved level in Grade 9 First Additional Language. Only about 2% oflearners function at high achievement levels.84 | <strong>REPORT</strong> <strong>ON</strong> <strong>THE</strong> ANNUAL NATI<strong>ON</strong>AL ASSESSMENTS <strong>OF</strong> <strong>2014</strong>