

REPORT ON THE ANA OF 2014
REPORT ON THE ANA OF 2014
REPORT ON THE ANA OF 2014
- No tags were found...

You also want an ePaper? Increase the reach of your titles
YUMPU automatically turns print PDFs into web optimized ePapers that Google loves.
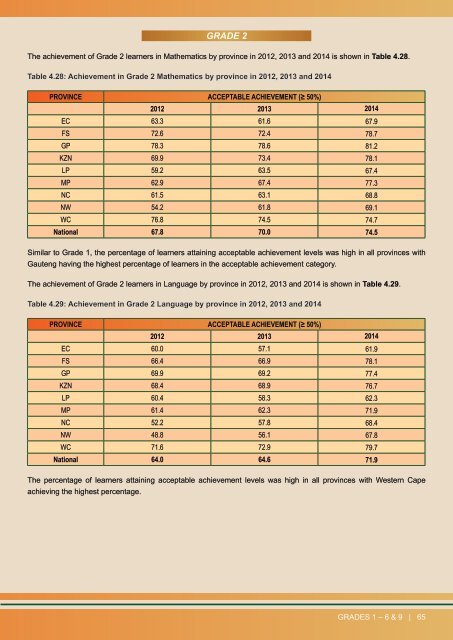
GRADE 2The achievement of Grade 2 learners in Mathematics by province in 2012, 2013 and <strong>2014</strong> is shown in Table 4.28.Table 4.28: Achievement in Grade 2 Mathematics by province in 2012, 2013 and <strong>2014</strong>PROVINCE ACCEPTABLE ACHIEVEMENT (≥ 50%)2012 2013 <strong>2014</strong>EC 63.3 61.6 67.9FS 72.6 72.4 78.7GP 78.3 78.6 81.2KZN 69.9 73.4 78.1LP 59.2 63.5 67.4MP 62.9 67.4 77.3NC 61.5 63.1 68.8NW 54.2 61.8 69.1WC 76.8 74.5 74.7National 67.8 70.0 74.5Similar to Grade 1, the percentage of learners attaining acceptable achievement levels was high in all provinces withGauteng having the highest percentage of learners in the acceptable achievement category.The achievement of Grade 2 learners in Language by province in 2012, 2013 and <strong>2014</strong> is shown in Table 4.29.Table 4.29: Achievement in Grade 2 Language by province in 2012, 2013 and <strong>2014</strong>PROVINCE ACCEPTABLE ACHIEVEMENT (≥ 50%)2012 2013 <strong>2014</strong>EC 60.0 57.1 61.9FS 66.4 66.9 78.1GP 69.9 69.2 77.4KZN 68.4 68.9 76.7LP 60.4 58.3 62.3MP 61.4 62.3 71.9NC 52.2 57.8 68.4NW 48.8 56.1 67.8WC 71.6 72.9 79.7National 64.0 64.6 71.9The percentage of learners attaining acceptable achievement levels was high in all provinces with Western Capeachieving the highest percentage.GRADES 1 – 6 & 9 | 65