

REPORT ON THE ANA OF 2014
REPORT ON THE ANA OF 2014
REPORT ON THE ANA OF 2014
- No tags were found...

Create successful ePaper yourself
Turn your PDF publications into a flip-book with our unique Google optimized e-Paper software.
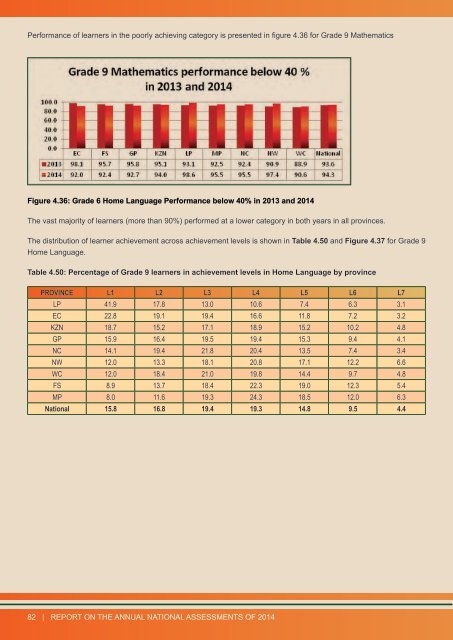
Performance of learners in the poorly achieving category is presented in figure 4.36 for Grade 9 MathematicsFigure 4.36: Grade 6 Home Language Performance below 40% in 2013 and <strong>2014</strong>The vast majority of learners (more than 90%) performed at a lower category in both years in all provinces.The distribution of learner achievement across achievement levels is shown in Table 4.50 and Figure 4.37 for Grade 9Home Language.Table 4.50: Percentage of Grade 9 learners in achievement levels in Home Language by provincePROVINCE L1 L2 L3 L4 L5 L6 L7LP 41.9 17.8 13.0 10.6 7.4 6.3 3.1EC 22.8 19.1 19.4 16.6 11.8 7.2 3.2KZN 18.7 15.2 17.1 18.9 15.2 10.2 4.8GP 15.9 16.4 19.5 19.4 15.3 9.4 4.1NC 14.1 19.4 21.8 20.4 13.5 7.4 3.4NW 12.0 13.3 18.1 20.8 17.1 12.2 6.6WC 12.0 18.4 21.0 19.8 14.4 9.7 4.8FS 8.9 13.7 18.4 22.3 19.0 12.3 5.4MP 8.0 11.6 19.3 24.3 18.5 12.0 6.3National 15.8 16.8 19.4 19.3 14.8 9.5 4.482 | <strong>REPORT</strong> <strong>ON</strong> <strong>THE</strong> ANNUAL NATI<strong>ON</strong>AL ASSESSMENTS <strong>OF</strong> <strong>2014</strong>